Immigrants from Thailand vs Yup'ik Bachelor's Degree
COMPARE
Immigrants from Thailand
Yup'ik
Bachelor's Degree
Bachelor's Degree Comparison
Immigrants from Thailand
Yup'ik
36.5%
BACHELOR'S DEGREE
19.4/ 100
METRIC RATING
208th/ 347
METRIC RANK
19.4%
BACHELOR'S DEGREE
0.0/ 100
METRIC RATING
347th/ 347
METRIC RANK
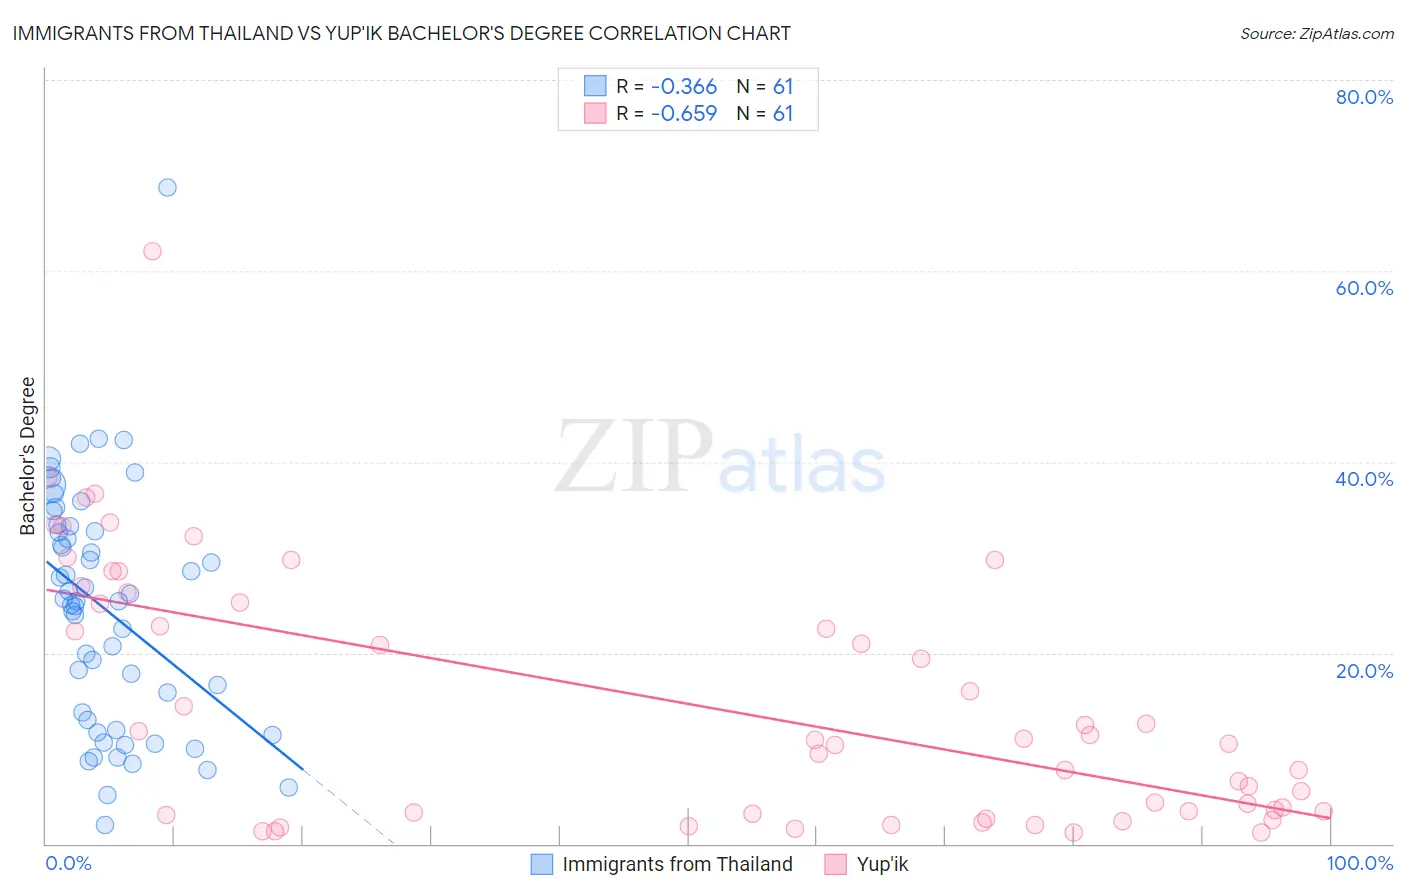
Immigrants from Thailand vs Yup'ik Bachelor's Degree Correlation Chart
The statistical analysis conducted on geographies consisting of 317,007,360 people shows a mild negative correlation between the proportion of Immigrants from Thailand and percentage of population with at least bachelor's degree education in the United States with a correlation coefficient (R) of -0.366 and weighted average of 36.5%. Similarly, the statistical analysis conducted on geographies consisting of 39,961,864 people shows a significant negative correlation between the proportion of Yup'ik and percentage of population with at least bachelor's degree education in the United States with a correlation coefficient (R) of -0.659 and weighted average of 19.4%, a difference of 88.1%.
Bachelor's Degree Correlation Summary
| Measurement | Immigrants from Thailand | Yup'ik |
| Minimum | 1.9% | 1.2% |
| Maximum | 68.8% | 62.1% |
| Range | 66.8% | 60.9% |
| Mean | 24.5% | 14.8% |
| Median | 25.4% | 10.9% |
| Interquartile 25% (IQ1) | 12.4% | 3.2% |
| Interquartile 75% (IQ3) | 33.0% | 25.8% |
| Interquartile Range (IQR) | 20.6% | 22.6% |
| Standard Deviation (Sample) | 12.5% | 13.3% |
| Standard Deviation (Population) | 12.4% | 13.2% |
Similar Demographics by Bachelor's Degree
Demographics Similar to Immigrants from Thailand by Bachelor's Degree
In terms of bachelor's degree, the demographic groups most similar to Immigrants from Thailand are Panamanian (36.5%, a difference of 0.10%), French (36.5%, a difference of 0.13%), Scotch-Irish (36.4%, a difference of 0.18%), Immigrants from Middle Africa (36.6%, a difference of 0.19%), and Immigrants from Philippines (36.4%, a difference of 0.26%).
| Demographics | Rating | Rank | Bachelor's Degree |
| Immigrants | South Eastern Asia | 25.4 /100 | #201 | Fair 36.8% |
| Immigrants | Zaire | 25.3 /100 | #202 | Fair 36.8% |
| Immigrants | Nigeria | 23.1 /100 | #203 | Fair 36.7% |
| Immigrants | Immigrants | 22.8 /100 | #204 | Fair 36.7% |
| Finns | 22.2 /100 | #205 | Fair 36.7% |
| Spaniards | 21.2 /100 | #206 | Fair 36.6% |
| Immigrants | Middle Africa | 20.6 /100 | #207 | Fair 36.6% |
| Immigrants | Thailand | 19.4 /100 | #208 | Poor 36.5% |
| Panamanians | 18.8 /100 | #209 | Poor 36.5% |
| French | 18.6 /100 | #210 | Poor 36.5% |
| Scotch-Irish | 18.3 /100 | #211 | Poor 36.4% |
| Immigrants | Philippines | 17.8 /100 | #212 | Poor 36.4% |
| Immigrants | Panama | 14.2 /100 | #213 | Poor 36.2% |
| Germans | 13.9 /100 | #214 | Poor 36.1% |
| Immigrants | Western Africa | 13.8 /100 | #215 | Poor 36.1% |
Demographics Similar to Yup'ik by Bachelor's Degree
In terms of bachelor's degree, the demographic groups most similar to Yup'ik are Houma (21.4%, a difference of 10.4%), Pima (23.2%, a difference of 19.5%), Navajo (23.6%, a difference of 21.6%), Tohono O'odham (24.4%, a difference of 25.8%), and Yakama (24.5%, a difference of 26.0%).
| Demographics | Rating | Rank | Bachelor's Degree |
| Mexicans | 0.0 /100 | #333 | Tragic 27.1% |
| Arapaho | 0.0 /100 | #334 | Tragic 26.6% |
| Natives/Alaskans | 0.0 /100 | #335 | Tragic 26.3% |
| Immigrants | Mexico | 0.0 /100 | #336 | Tragic 26.1% |
| Inupiat | 0.0 /100 | #337 | Tragic 25.8% |
| Pueblo | 0.0 /100 | #338 | Tragic 25.5% |
| Hopi | 0.0 /100 | #339 | Tragic 25.3% |
| Lumbee | 0.0 /100 | #340 | Tragic 24.8% |
| Yuman | 0.0 /100 | #341 | Tragic 24.5% |
| Yakama | 0.0 /100 | #342 | Tragic 24.5% |
| Tohono O'odham | 0.0 /100 | #343 | Tragic 24.4% |
| Navajo | 0.0 /100 | #344 | Tragic 23.6% |
| Pima | 0.0 /100 | #345 | Tragic 23.2% |
| Houma | 0.0 /100 | #346 | Tragic 21.4% |
| Yup'ik | 0.0 /100 | #347 | Tragic 19.4% |