Immigrants from Thailand vs Mexican 1st Grade
COMPARE
Immigrants from Thailand
Mexican
1st Grade
1st Grade Comparison
Immigrants from Thailand
Mexicans
97.3%
1ST GRADE
0.0/ 100
METRIC RATING
288th/ 347
METRIC RANK
96.7%
1ST GRADE
0.0/ 100
METRIC RATING
327th/ 347
METRIC RANK
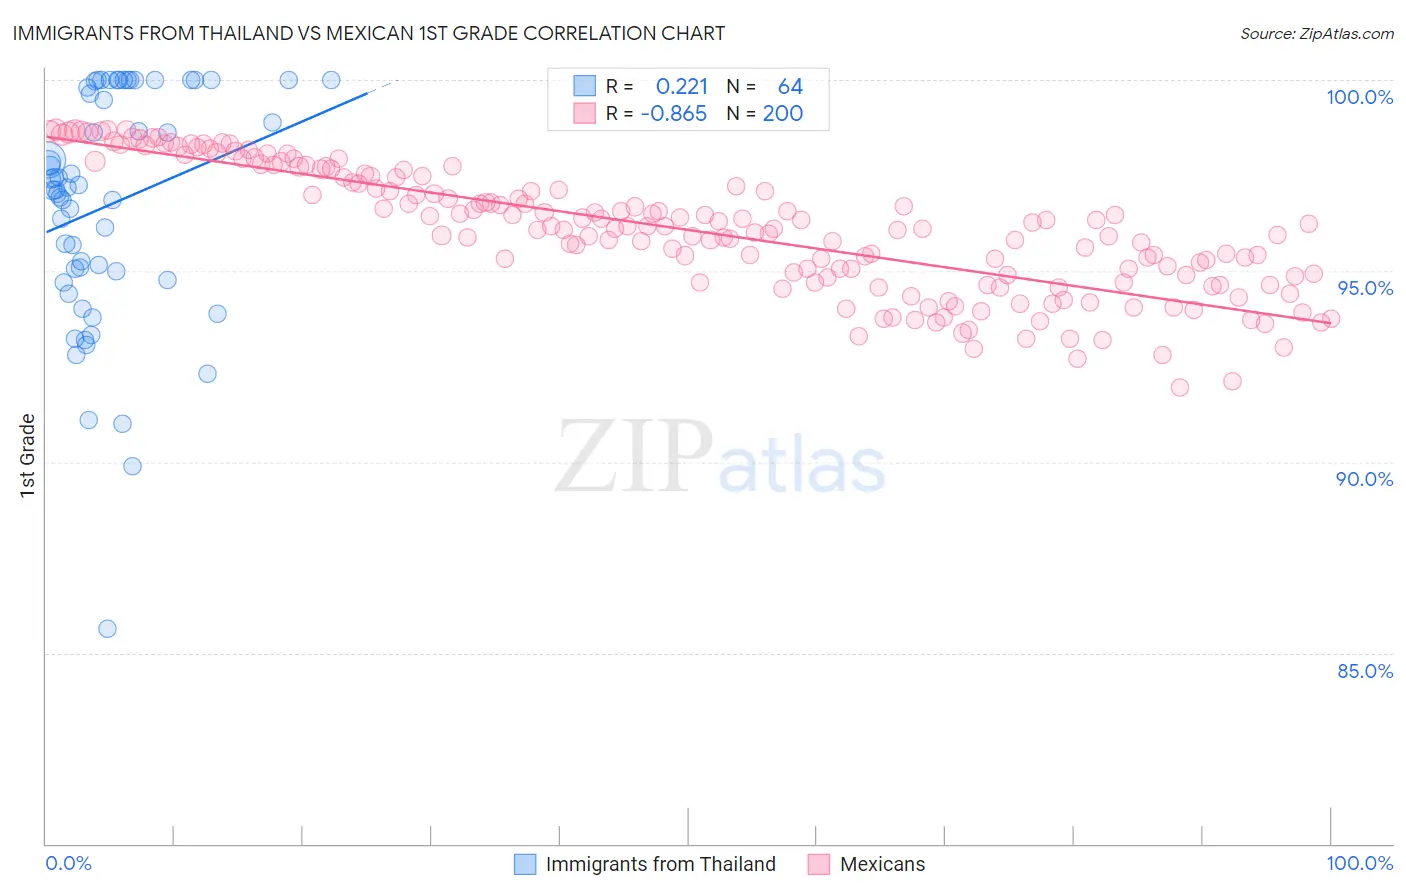
Immigrants from Thailand vs Mexican 1st Grade Correlation Chart
The statistical analysis conducted on geographies consisting of 317,003,309 people shows a weak positive correlation between the proportion of Immigrants from Thailand and percentage of population with at least 1st grade education in the United States with a correlation coefficient (R) of 0.221 and weighted average of 97.3%. Similarly, the statistical analysis conducted on geographies consisting of 565,340,458 people shows a very strong negative correlation between the proportion of Mexicans and percentage of population with at least 1st grade education in the United States with a correlation coefficient (R) of -0.865 and weighted average of 96.7%, a difference of 0.63%.
1st Grade Correlation Summary
| Measurement | Immigrants from Thailand | Mexican |
| Minimum | 85.6% | 91.9% |
| Maximum | 100.0% | 98.7% |
| Range | 14.4% | 6.8% |
| Mean | 96.7% | 96.1% |
| Median | 97.2% | 96.1% |
| Interquartile 25% (IQ1) | 94.9% | 94.9% |
| Interquartile 75% (IQ3) | 99.9% | 97.5% |
| Interquartile Range (IQR) | 5.0% | 2.6% |
| Standard Deviation (Sample) | 3.1% | 1.6% |
| Standard Deviation (Population) | 3.0% | 1.6% |
Similar Demographics by 1st Grade
Demographics Similar to Immigrants from Thailand by 1st Grade
In terms of 1st grade, the demographic groups most similar to Immigrants from Thailand are Immigrants from Hong Kong (97.3%, a difference of 0.0%), Immigrants from Barbados (97.3%, a difference of 0.010%), Immigrants from Afghanistan (97.3%, a difference of 0.020%), Immigrants from Trinidad and Tobago (97.3%, a difference of 0.030%), and Immigrants from Portugal (97.3%, a difference of 0.030%).
| Demographics | Rating | Rank | 1st Grade |
| Trinidadians and Tobagonians | 0.1 /100 | #281 | Tragic 97.3% |
| Barbadians | 0.1 /100 | #282 | Tragic 97.3% |
| Immigrants | West Indies | 0.0 /100 | #283 | Tragic 97.3% |
| Immigrants | Trinidad and Tobago | 0.0 /100 | #284 | Tragic 97.3% |
| Immigrants | Portugal | 0.0 /100 | #285 | Tragic 97.3% |
| Immigrants | Barbados | 0.0 /100 | #286 | Tragic 97.3% |
| Immigrants | Hong Kong | 0.0 /100 | #287 | Tragic 97.3% |
| Immigrants | Thailand | 0.0 /100 | #288 | Tragic 97.3% |
| Immigrants | Afghanistan | 0.0 /100 | #289 | Tragic 97.3% |
| Immigrants | St. Vincent and the Grenadines | 0.0 /100 | #290 | Tragic 97.3% |
| Houma | 0.0 /100 | #291 | Tragic 97.2% |
| British West Indians | 0.0 /100 | #292 | Tragic 97.2% |
| Malaysians | 0.0 /100 | #293 | Tragic 97.2% |
| Immigrants | Grenada | 0.0 /100 | #294 | Tragic 97.2% |
| Immigrants | Immigrants | 0.0 /100 | #295 | Tragic 97.2% |
Demographics Similar to Mexicans by 1st Grade
In terms of 1st grade, the demographic groups most similar to Mexicans are Immigrants from Latin America (96.7%, a difference of 0.010%), Japanese (96.6%, a difference of 0.050%), Immigrants from Vietnam (96.6%, a difference of 0.060%), Dominican (96.7%, a difference of 0.070%), and Indonesian (96.7%, a difference of 0.070%).
| Demographics | Rating | Rank | 1st Grade |
| Immigrants | Burma/Myanmar | 0.0 /100 | #320 | Tragic 96.8% |
| Immigrants | Bangladesh | 0.0 /100 | #321 | Tragic 96.8% |
| Mexican American Indians | 0.0 /100 | #322 | Tragic 96.8% |
| Immigrants | Honduras | 0.0 /100 | #323 | Tragic 96.8% |
| Vietnamese | 0.0 /100 | #324 | Tragic 96.8% |
| Dominicans | 0.0 /100 | #325 | Tragic 96.7% |
| Indonesians | 0.0 /100 | #326 | Tragic 96.7% |
| Mexicans | 0.0 /100 | #327 | Tragic 96.7% |
| Immigrants | Latin America | 0.0 /100 | #328 | Tragic 96.7% |
| Japanese | 0.0 /100 | #329 | Tragic 96.6% |
| Immigrants | Vietnam | 0.0 /100 | #330 | Tragic 96.6% |
| Immigrants | Armenia | 0.0 /100 | #331 | Tragic 96.6% |
| Central Americans | 0.0 /100 | #332 | Tragic 96.5% |
| Immigrants | Dominican Republic | 0.0 /100 | #333 | Tragic 96.5% |
| Bangladeshis | 0.0 /100 | #334 | Tragic 96.5% |