Immigrants from Thailand vs Immigrants from Honduras 11th Grade
COMPARE
Immigrants from Thailand
Immigrants from Honduras
11th Grade
11th Grade Comparison
Immigrants from Thailand
Immigrants from Honduras
91.6%
11TH GRADE
1.4/ 100
METRIC RATING
243rd/ 347
METRIC RANK
86.9%
11TH GRADE
0.0/ 100
METRIC RATING
337th/ 347
METRIC RANK
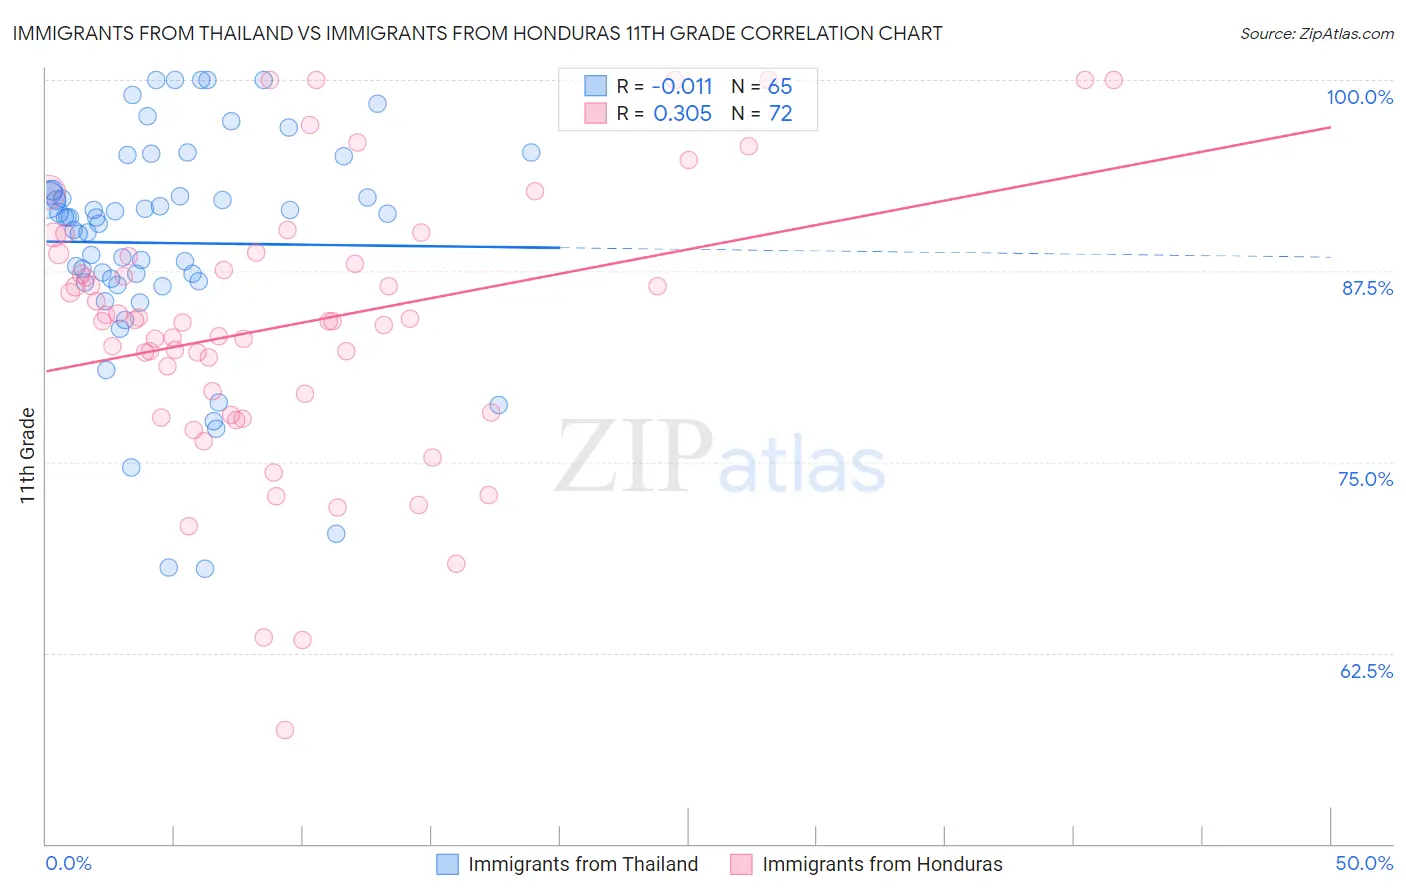
Immigrants from Thailand vs Immigrants from Honduras 11th Grade Correlation Chart
The statistical analysis conducted on geographies consisting of 317,023,903 people shows no correlation between the proportion of Immigrants from Thailand and percentage of population with at least 11th grade education in the United States with a correlation coefficient (R) of -0.011 and weighted average of 91.6%. Similarly, the statistical analysis conducted on geographies consisting of 322,637,445 people shows a mild positive correlation between the proportion of Immigrants from Honduras and percentage of population with at least 11th grade education in the United States with a correlation coefficient (R) of 0.305 and weighted average of 86.9%, a difference of 5.4%.
11th Grade Correlation Summary
| Measurement | Immigrants from Thailand | Immigrants from Honduras |
| Minimum | 68.0% | 57.4% |
| Maximum | 100.0% | 100.0% |
| Range | 32.0% | 42.6% |
| Mean | 89.3% | 84.0% |
| Median | 91.0% | 84.2% |
| Interquartile 25% (IQ1) | 86.8% | 78.8% |
| Interquartile 75% (IQ3) | 92.7% | 88.5% |
| Interquartile Range (IQR) | 5.9% | 9.7% |
| Standard Deviation (Sample) | 7.3% | 8.9% |
| Standard Deviation (Population) | 7.3% | 8.8% |
Similar Demographics by 11th Grade
Demographics Similar to Immigrants from Thailand by 11th Grade
In terms of 11th grade, the demographic groups most similar to Immigrants from Thailand are Senegalese (91.6%, a difference of 0.010%), African (91.5%, a difference of 0.020%), Immigrants from Middle Africa (91.6%, a difference of 0.030%), Seminole (91.5%, a difference of 0.050%), and Bahamian (91.6%, a difference of 0.060%).
| Demographics | Rating | Rank | 11th Grade |
| Colombians | 2.8 /100 | #236 | Tragic 91.7% |
| Immigrants | Bolivia | 2.8 /100 | #237 | Tragic 91.7% |
| Comanche | 2.6 /100 | #238 | Tragic 91.7% |
| Hopi | 2.5 /100 | #239 | Tragic 91.7% |
| South Americans | 2.0 /100 | #240 | Tragic 91.6% |
| Bahamians | 1.8 /100 | #241 | Tragic 91.6% |
| Immigrants | Middle Africa | 1.6 /100 | #242 | Tragic 91.6% |
| Immigrants | Thailand | 1.4 /100 | #243 | Tragic 91.6% |
| Senegalese | 1.4 /100 | #244 | Tragic 91.6% |
| Africans | 1.3 /100 | #245 | Tragic 91.5% |
| Seminole | 1.2 /100 | #246 | Tragic 91.5% |
| Immigrants | Philippines | 1.0 /100 | #247 | Tragic 91.5% |
| Immigrants | Uzbekistan | 1.0 /100 | #248 | Tragic 91.5% |
| Peruvians | 1.0 /100 | #249 | Tragic 91.5% |
| Ghanaians | 0.9 /100 | #250 | Tragic 91.5% |
Demographics Similar to Immigrants from Honduras by 11th Grade
In terms of 11th grade, the demographic groups most similar to Immigrants from Honduras are Immigrants from Dominican Republic (86.9%, a difference of 0.0%), Central American (86.9%, a difference of 0.040%), Immigrants from Latin America (86.8%, a difference of 0.12%), Houma (87.0%, a difference of 0.14%), and Immigrants from Yemen (87.1%, a difference of 0.21%).
| Demographics | Rating | Rank | 11th Grade |
| Hondurans | 0.0 /100 | #330 | Tragic 87.4% |
| Hispanics or Latinos | 0.0 /100 | #331 | Tragic 87.3% |
| Immigrants | Azores | 0.0 /100 | #332 | Tragic 87.2% |
| Immigrants | Yemen | 0.0 /100 | #333 | Tragic 87.1% |
| Houma | 0.0 /100 | #334 | Tragic 87.0% |
| Central Americans | 0.0 /100 | #335 | Tragic 86.9% |
| Immigrants | Dominican Republic | 0.0 /100 | #336 | Tragic 86.9% |
| Immigrants | Honduras | 0.0 /100 | #337 | Tragic 86.9% |
| Immigrants | Latin America | 0.0 /100 | #338 | Tragic 86.8% |
| Guatemalans | 0.0 /100 | #339 | Tragic 86.4% |
| Salvadorans | 0.0 /100 | #340 | Tragic 86.2% |
| Mexicans | 0.0 /100 | #341 | Tragic 86.1% |
| Immigrants | Guatemala | 0.0 /100 | #342 | Tragic 85.8% |
| Immigrants | El Salvador | 0.0 /100 | #343 | Tragic 85.3% |
| Yakama | 0.0 /100 | #344 | Tragic 85.0% |