Immigrants from Thailand vs Immigrants from Bulgaria 9th Grade
COMPARE
Immigrants from Thailand
Immigrants from Bulgaria
9th Grade
9th Grade Comparison
Immigrants from Thailand
Immigrants from Bulgaria
93.9%
9TH GRADE
0.5/ 100
METRIC RATING
258th/ 347
METRIC RANK
95.5%
9TH GRADE
96.7/ 100
METRIC RATING
110th/ 347
METRIC RANK
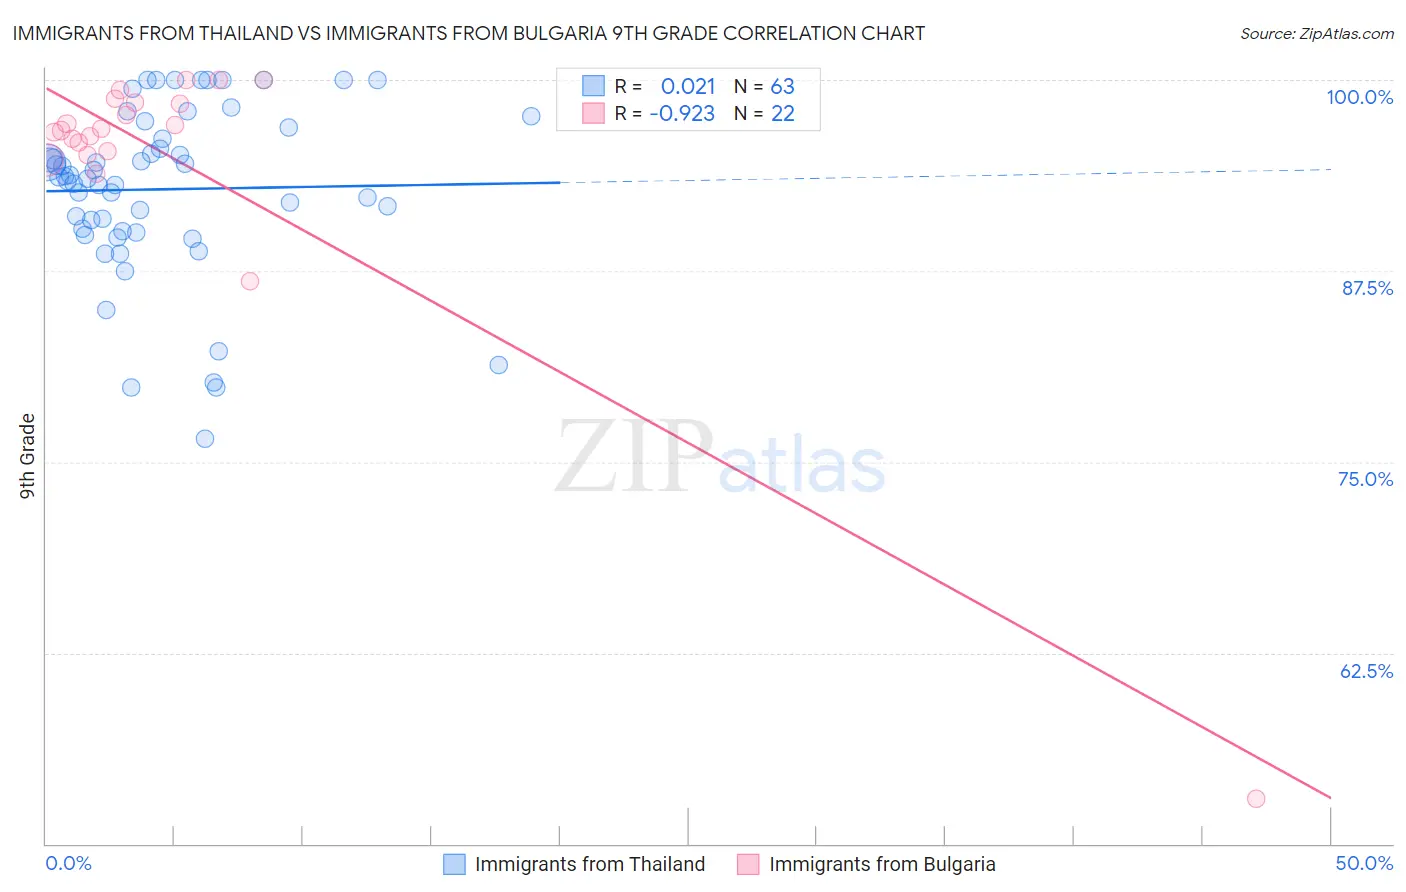
Immigrants from Thailand vs Immigrants from Bulgaria 9th Grade Correlation Chart
The statistical analysis conducted on geographies consisting of 317,022,438 people shows no correlation between the proportion of Immigrants from Thailand and percentage of population with at least 9th grade education in the United States with a correlation coefficient (R) of 0.021 and weighted average of 93.9%. Similarly, the statistical analysis conducted on geographies consisting of 172,552,181 people shows a near-perfect negative correlation between the proportion of Immigrants from Bulgaria and percentage of population with at least 9th grade education in the United States with a correlation coefficient (R) of -0.923 and weighted average of 95.5%, a difference of 1.6%.
9th Grade Correlation Summary
| Measurement | Immigrants from Thailand | Immigrants from Bulgaria |
| Minimum | 76.6% | 52.9% |
| Maximum | 100.0% | 100.0% |
| Range | 23.4% | 47.1% |
| Mean | 92.8% | 94.7% |
| Median | 93.6% | 96.8% |
| Interquartile 25% (IQ1) | 90.1% | 95.3% |
| Interquartile 75% (IQ3) | 96.9% | 98.5% |
| Interquartile Range (IQR) | 6.7% | 3.2% |
| Standard Deviation (Sample) | 5.6% | 9.8% |
| Standard Deviation (Population) | 5.5% | 9.5% |
Similar Demographics by 9th Grade
Demographics Similar to Immigrants from Thailand by 9th Grade
In terms of 9th grade, the demographic groups most similar to Immigrants from Thailand are Ghanaian (93.9%, a difference of 0.0%), Immigrants from Costa Rica (94.0%, a difference of 0.010%), Pima (93.9%, a difference of 0.010%), Immigrants from Afghanistan (94.0%, a difference of 0.020%), and South American (93.9%, a difference of 0.020%).
| Demographics | Rating | Rank | 9th Grade |
| Jamaicans | 1.0 /100 | #251 | Tragic 94.1% |
| Immigrants | Senegal | 0.9 /100 | #252 | Tragic 94.1% |
| Colombians | 0.8 /100 | #253 | Tragic 94.0% |
| U.S. Virgin Islanders | 0.7 /100 | #254 | Tragic 94.0% |
| Immigrants | Nigeria | 0.6 /100 | #255 | Tragic 94.0% |
| Immigrants | Afghanistan | 0.5 /100 | #256 | Tragic 94.0% |
| Immigrants | Costa Rica | 0.5 /100 | #257 | Tragic 94.0% |
| Immigrants | Thailand | 0.5 /100 | #258 | Tragic 93.9% |
| Ghanaians | 0.5 /100 | #259 | Tragic 93.9% |
| Pima | 0.4 /100 | #260 | Tragic 93.9% |
| South Americans | 0.4 /100 | #261 | Tragic 93.9% |
| Immigrants | Jamaica | 0.4 /100 | #262 | Tragic 93.9% |
| Immigrants | Uzbekistan | 0.4 /100 | #263 | Tragic 93.9% |
| Immigrants | Congo | 0.4 /100 | #264 | Tragic 93.9% |
| Natives/Alaskans | 0.4 /100 | #265 | Tragic 93.9% |
Demographics Similar to Immigrants from Bulgaria by 9th Grade
In terms of 9th grade, the demographic groups most similar to Immigrants from Bulgaria are Chickasaw (95.5%, a difference of 0.0%), Osage (95.5%, a difference of 0.0%), Immigrants from Zimbabwe (95.5%, a difference of 0.010%), Immigrants from Norway (95.5%, a difference of 0.020%), and Cherokee (95.4%, a difference of 0.020%).
| Demographics | Rating | Rank | 9th Grade |
| Potawatomi | 97.7 /100 | #103 | Exceptional 95.5% |
| Syrians | 97.4 /100 | #104 | Exceptional 95.5% |
| Immigrants | France | 97.4 /100 | #105 | Exceptional 95.5% |
| Immigrants | Norway | 97.1 /100 | #106 | Exceptional 95.5% |
| Immigrants | Zimbabwe | 96.9 /100 | #107 | Exceptional 95.5% |
| Chickasaw | 96.8 /100 | #108 | Exceptional 95.5% |
| Osage | 96.8 /100 | #109 | Exceptional 95.5% |
| Immigrants | Bulgaria | 96.7 /100 | #110 | Exceptional 95.5% |
| Cherokee | 96.3 /100 | #111 | Exceptional 95.4% |
| Immigrants | Croatia | 96.2 /100 | #112 | Exceptional 95.4% |
| Iroquois | 96.2 /100 | #113 | Exceptional 95.4% |
| German Russians | 96.1 /100 | #114 | Exceptional 95.4% |
| Burmese | 96.0 /100 | #115 | Exceptional 95.4% |
| Immigrants | Europe | 95.7 /100 | #116 | Exceptional 95.4% |
| Immigrants | Romania | 95.6 /100 | #117 | Exceptional 95.4% |