Immigrants from Thailand vs Hungarian 2nd Grade
COMPARE
Immigrants from Thailand
Hungarian
2nd Grade
2nd Grade Comparison
Immigrants from Thailand
Hungarians
97.2%
2ND GRADE
0.0/ 100
METRIC RATING
288th/ 347
METRIC RANK
98.4%
2ND GRADE
99.9/ 100
METRIC RATING
45th/ 347
METRIC RANK
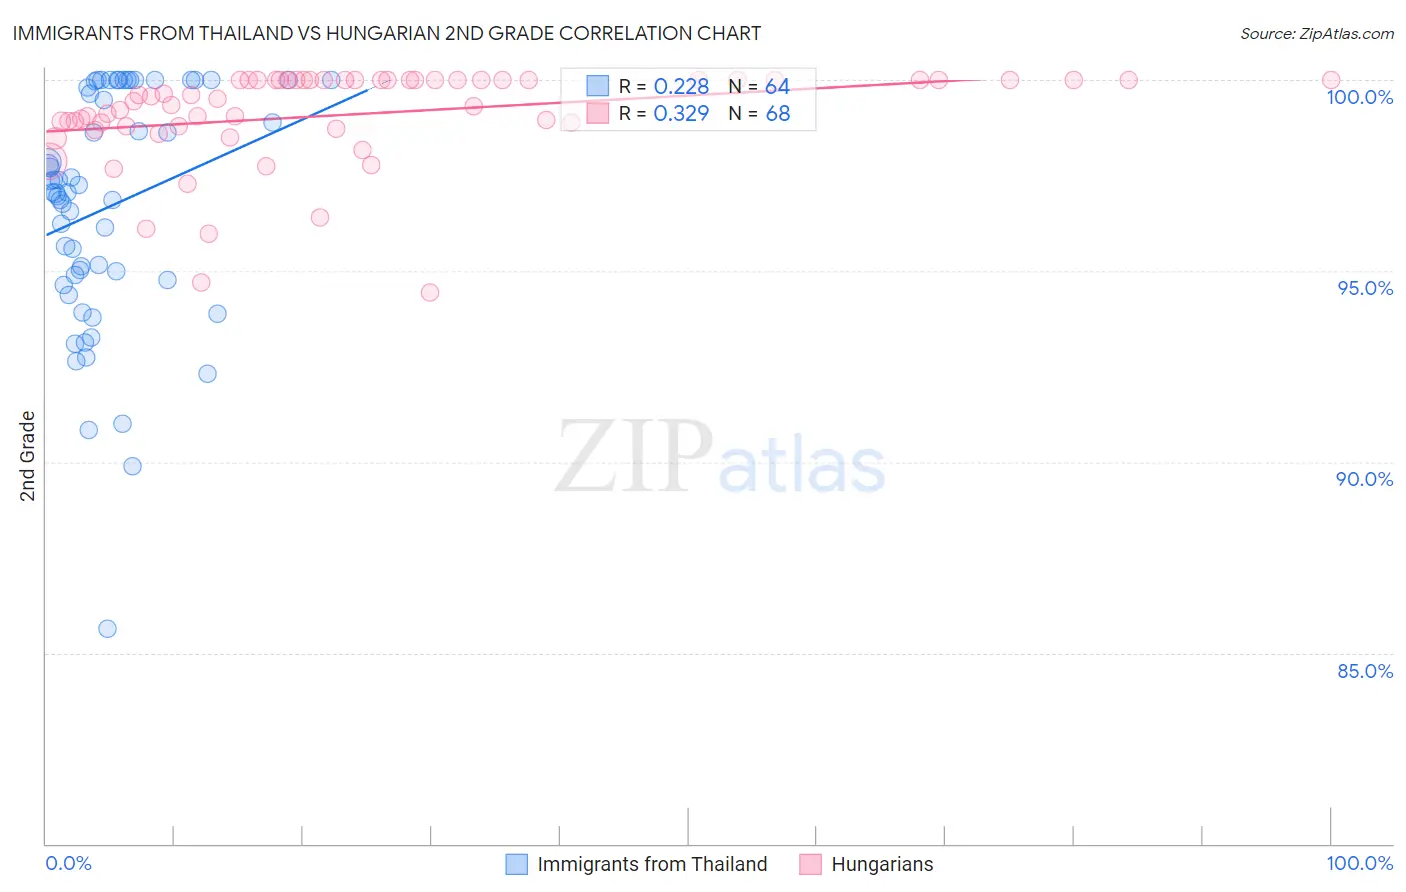
Immigrants from Thailand vs Hungarian 2nd Grade Correlation Chart
The statistical analysis conducted on geographies consisting of 317,003,309 people shows a weak positive correlation between the proportion of Immigrants from Thailand and percentage of population with at least 2nd grade education in the United States with a correlation coefficient (R) of 0.228 and weighted average of 97.2%. Similarly, the statistical analysis conducted on geographies consisting of 486,239,439 people shows a mild positive correlation between the proportion of Hungarians and percentage of population with at least 2nd grade education in the United States with a correlation coefficient (R) of 0.329 and weighted average of 98.4%, a difference of 1.2%.
2nd Grade Correlation Summary
| Measurement | Immigrants from Thailand | Hungarian |
| Minimum | 85.6% | 94.4% |
| Maximum | 100.0% | 100.0% |
| Range | 14.4% | 5.6% |
| Mean | 96.7% | 99.1% |
| Median | 97.1% | 99.5% |
| Interquartile 25% (IQ1) | 94.8% | 98.8% |
| Interquartile 75% (IQ3) | 99.9% | 100.0% |
| Interquartile Range (IQR) | 5.0% | 1.2% |
| Standard Deviation (Sample) | 3.1% | 1.3% |
| Standard Deviation (Population) | 3.1% | 1.2% |
Similar Demographics by 2nd Grade
Demographics Similar to Immigrants from Thailand by 2nd Grade
In terms of 2nd grade, the demographic groups most similar to Immigrants from Thailand are Immigrants from Hong Kong (97.2%, a difference of 0.010%), Immigrants from Barbados (97.2%, a difference of 0.010%), Immigrants from Portugal (97.2%, a difference of 0.010%), Immigrants from West Indies (97.2%, a difference of 0.020%), and Houma (97.2%, a difference of 0.020%).
| Demographics | Rating | Rank | 2nd Grade |
| Trinidadians and Tobagonians | 0.1 /100 | #281 | Tragic 97.3% |
| Barbadians | 0.1 /100 | #282 | Tragic 97.3% |
| Immigrants | Trinidad and Tobago | 0.0 /100 | #283 | Tragic 97.2% |
| Immigrants | West Indies | 0.0 /100 | #284 | Tragic 97.2% |
| Immigrants | Hong Kong | 0.0 /100 | #285 | Tragic 97.2% |
| Immigrants | Barbados | 0.0 /100 | #286 | Tragic 97.2% |
| Immigrants | Portugal | 0.0 /100 | #287 | Tragic 97.2% |
| Immigrants | Thailand | 0.0 /100 | #288 | Tragic 97.2% |
| Houma | 0.0 /100 | #289 | Tragic 97.2% |
| Immigrants | St. Vincent and the Grenadines | 0.0 /100 | #290 | Tragic 97.2% |
| Immigrants | Afghanistan | 0.0 /100 | #291 | Tragic 97.2% |
| Immigrants | Eritrea | 0.0 /100 | #292 | Tragic 97.2% |
| British West Indians | 0.0 /100 | #293 | Tragic 97.2% |
| Malaysians | 0.0 /100 | #294 | Tragic 97.1% |
| Immigrants | Grenada | 0.0 /100 | #295 | Tragic 97.1% |
Demographics Similar to Hungarians by 2nd Grade
In terms of 2nd grade, the demographic groups most similar to Hungarians are Lumbee (98.4%, a difference of 0.010%), Ottawa (98.4%, a difference of 0.010%), Native Hawaiian (98.4%, a difference of 0.020%), Belgian (98.4%, a difference of 0.020%), and Northern European (98.4%, a difference of 0.020%).
| Demographics | Rating | Rank | 2nd Grade |
| Latvians | 99.9 /100 | #38 | Exceptional 98.4% |
| Chippewa | 99.9 /100 | #39 | Exceptional 98.4% |
| Luxembourgers | 99.9 /100 | #40 | Exceptional 98.4% |
| Eastern Europeans | 99.9 /100 | #41 | Exceptional 98.4% |
| Native Hawaiians | 99.9 /100 | #42 | Exceptional 98.4% |
| Belgians | 99.9 /100 | #43 | Exceptional 98.4% |
| Northern Europeans | 99.9 /100 | #44 | Exceptional 98.4% |
| Hungarians | 99.9 /100 | #45 | Exceptional 98.4% |
| Lumbee | 99.9 /100 | #46 | Exceptional 98.4% |
| Ottawa | 99.9 /100 | #47 | Exceptional 98.4% |
| Czechoslovakians | 99.9 /100 | #48 | Exceptional 98.4% |
| Celtics | 99.8 /100 | #49 | Exceptional 98.4% |
| Whites/Caucasians | 99.8 /100 | #50 | Exceptional 98.4% |
| Estonians | 99.8 /100 | #51 | Exceptional 98.4% |
| Australians | 99.8 /100 | #52 | Exceptional 98.4% |