Immigrants from Taiwan vs Immigrants from Uruguay 1st Grade

COMPARE

Immigrants from Taiwan
Race
Ancestry
AfghanAfricanAlaska NativeAlaskan AthabascanAlbanianAleutAlsatianAmericanApacheArabArapahoArgentineanArmenianAssyrian/Chaldean/SyriacAustralianAustrianBahamianBangladeshiBarbadianBasqueBelgianBelizeanBermudanBhutaneseBlackfeetBolivianBrazilianBritishBritish West IndianBulgarianBurmeseCajunCambodianCanadianCape VerdeanCarpatho RusynCelticCentral AmericanCentral American IndianCherokeeCheyenneChickasawChileanChineseChippewaChoctawColombianColvilleComancheCosta RicanCreeCreekCroatianCrowCubanCypriotCzechCzechoslovakianDanishDelawareDominicanDutchDutch West IndianEastern EuropeanEcuadorianEgyptianEnglishEstonianEthiopianEuropeanFijianFilipinoFinnishFrenchFrench American IndianFrench CanadianGermanGerman RussianGhanaianGreekGuamanian/ChamorroGuatemalanGuyaneseHaitianHmongHonduranHopiHoumaHungarianIcelanderIndian (Asian)IndonesianInupiatIranianIraqiIrishIroquoisIsraeliItalianJamaicanJapaneseJordanianKenyanKiowaKoreanLaotianLatvianLebaneseLiberianLithuanianLumbeeLuxembourgerMacedonianMalaysianMalteseMarshalleseMenomineeMexicanMexican American IndianMongolianMoroccanNative HawaiianNavajoNepaleseNew ZealanderNicaraguanNigerianNorthern EuropeanNorwegianOkinawanOsageOttawaPaiutePakistaniPalestinianPanamanianParaguayanPennsylvania GermanPeruvianPimaPolishPortuguesePotawatomiPuebloPuerto RicanPuget Sound SalishRomanianRussianSalvadoranSamoanScandinavianScotch-IrishScottishSeminoleSenegaleseSerbianShoshoneSierra LeoneanSiouxSlavicSlovakSloveneSomaliSouth AfricanSouth AmericanSouth American IndianSoviet UnionSpaniardSpanishSpanish AmericanSpanish American IndianSri LankanSubsaharan AfricanSudaneseSwedishSwissSyrianTaiwaneseThaiTlingit-HaidaTohono O'OdhamTonganTrinidadian and TobagonianTsimshianTurkishU.S. Virgin IslanderUgandanUkrainianUruguayanUteVenezuelanVietnameseWelshWest IndianYakamaYaquiYugoslavianYumanYup'ikZimbabwean
Immigration
NonimmigrantsImmigrantsAfghanistanAfricaAlbaniaArgentinaArmeniaAsiaAustraliaAustriaBahamasBangladeshBarbadosBelarusBelgiumBelizeBoliviaBosnia and HerzegovinaBrazilBulgariaBurma/MyanmarCabo VerdeCambodiaCameroonCanadaCaribbeanCentral AmericaChileChinaColombiaCongoCosta RicaCroatiaCubaCzechoslovakiaDenmarkDominicaDominican RepublicEastern AfricaEastern AsiaEastern EuropeEcuadorEgyptEl SalvadorEnglandEritreaEthiopiaEuropeFijiFranceGermanyGhanaGreeceGrenadaGuatemalaGuyanaHaitiHondurasHong KongHungaryIndiaIndonesiaIranIraqIrelandIsraelItalyJamaicaJapanJordanKazakhstanKenyaKoreaKuwaitLaosLatin AmericaLatviaLebanonLiberiaLithuaniaMalaysiaMexicoMicronesiaMiddle AfricaMoldovaMoroccoNepalNetherlandsNicaraguaNigeriaNorth AmericaNorth MacedoniaNorthern AfricaNorthern EuropeNorwayOceaniaPakistanPanamaPeruPhilippinesPolandPortugalRomaniaRussiaSaudi ArabiaScotlandSenegalSerbiaSierra LeoneSingaporeSomaliaSouth AfricaSouth AmericaSouth Central AsiaSouth Eastern AsiaSouthern EuropeSpainSri LankaSt. Vincent and the GrenadinesSudanSwedenSwitzerlandSyriaTaiwanThailandTrinidad and TobagoTurkeyUgandaUkraineUzbekistanVenezuelaVietnamWest IndiesWestern AfricaWestern AsiaWestern EuropeYemenZaireZimbabweAzores
Immigrants from Uruguay
Race
Ancestry
AfghanAfricanAlaska NativeAlaskan AthabascanAlbanianAleutAlsatianAmericanApacheArabArapahoArgentineanArmenianAssyrian/Chaldean/SyriacAustralianAustrianBahamianBangladeshiBarbadianBasqueBelgianBelizeanBermudanBhutaneseBlackfeetBolivianBrazilianBritishBritish West IndianBulgarianBurmeseCajunCambodianCanadianCape VerdeanCarpatho RusynCelticCentral AmericanCentral American IndianCherokeeCheyenneChickasawChileanChineseChippewaChoctawColombianColvilleComancheCosta RicanCreeCreekCroatianCrowCubanCypriotCzechCzechoslovakianDanishDelawareDominicanDutchDutch West IndianEastern EuropeanEcuadorianEgyptianEnglishEstonianEthiopianEuropeanFijianFilipinoFinnishFrenchFrench American IndianFrench CanadianGermanGerman RussianGhanaianGreekGuamanian/ChamorroGuatemalanGuyaneseHaitianHmongHonduranHopiHoumaHungarianIcelanderIndian (Asian)IndonesianInupiatIranianIraqiIrishIroquoisIsraeliItalianJamaicanJapaneseJordanianKenyanKiowaKoreanLaotianLatvianLebaneseLiberianLithuanianLumbeeLuxembourgerMacedonianMalaysianMalteseMarshalleseMenomineeMexicanMexican American IndianMongolianMoroccanNative HawaiianNavajoNepaleseNew ZealanderNicaraguanNigerianNorthern EuropeanNorwegianOkinawanOsageOttawaPaiutePakistaniPalestinianPanamanianParaguayanPennsylvania GermanPeruvianPimaPolishPortuguesePotawatomiPuebloPuerto RicanPuget Sound SalishRomanianRussianSalvadoranSamoanScandinavianScotch-IrishScottishSeminoleSenegaleseSerbianShoshoneSierra LeoneanSiouxSlavicSlovakSloveneSomaliSouth AfricanSouth AmericanSouth American IndianSoviet UnionSpaniardSpanishSpanish AmericanSpanish American IndianSri LankanSubsaharan AfricanSudaneseSwedishSwissSyrianTaiwaneseThaiTlingit-HaidaTohono O'OdhamTonganTrinidadian and TobagonianTsimshianTurkishU.S. Virgin IslanderUgandanUkrainianUruguayanUteVenezuelanVietnameseWelshWest IndianYakamaYaquiYugoslavianYumanYup'ikZimbabwean
Immigration
NonimmigrantsImmigrantsAfghanistanAfricaAlbaniaArgentinaArmeniaAsiaAustraliaAustriaBahamasBangladeshBarbadosBelarusBelgiumBelizeBoliviaBosnia and HerzegovinaBrazilBulgariaBurma/MyanmarCabo VerdeCambodiaCameroonCanadaCaribbeanCentral AmericaChileChinaColombiaCongoCosta RicaCroatiaCubaCzechoslovakiaDenmarkDominicaDominican RepublicEastern AfricaEastern AsiaEastern EuropeEcuadorEgyptEl SalvadorEnglandEritreaEthiopiaEuropeFijiFranceGermanyGhanaGreeceGrenadaGuatemalaGuyanaHaitiHondurasHong KongHungaryIndiaIndonesiaIranIraqIrelandIsraelItalyJamaicaJapanJordanKazakhstanKenyaKoreaKuwaitLaosLatin AmericaLatviaLebanonLiberiaLithuaniaMalaysiaMexicoMicronesiaMiddle AfricaMoldovaMoroccoNepalNetherlandsNicaraguaNigeriaNorth AmericaNorth MacedoniaNorthern AfricaNorthern EuropeNorwayOceaniaPakistanPanamaPeruPhilippinesPolandPortugalRomaniaRussiaSaudi ArabiaScotlandSenegalSerbiaSierra LeoneSingaporeSomaliaSouth AfricaSouth AmericaSouth Central AsiaSouth Eastern AsiaSouthern EuropeSpainSri LankaSt. Vincent and the GrenadinesSudanSwedenSwitzerlandSyriaThailandTrinidad and TobagoTurkeyUgandaUkraineUruguayUzbekistanVenezuelaVietnamWest IndiesWestern AfricaWestern AsiaWestern EuropeYemenZaireZimbabweAzores
1st Grade
Income
Poverty
Unemployment
Labor Participation
Family Structure
Vehicle Availability
Education Level
Disability

1st Grade Comparison

Immigrants from Taiwan

Immigrants from Uruguay

Fair
Tragic
97.9%
1ST GRADE
29.4/ 100
METRIC RATING
193rd/ 347
METRIC RANK
97.6%
1ST GRADE
2.5/ 100
METRIC RATING
232nd/ 347
METRIC RANK

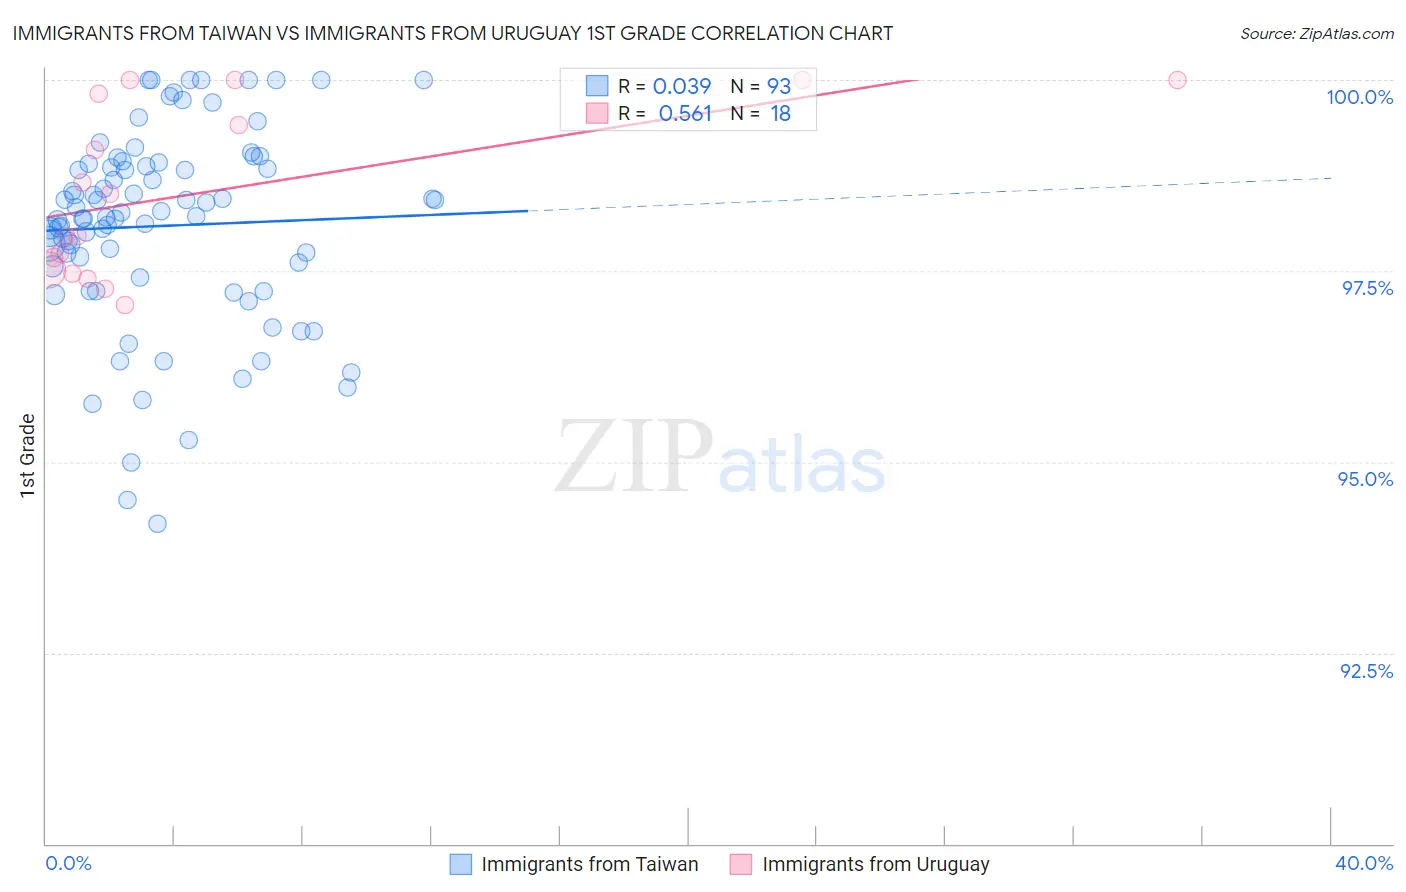
Immigrants from Taiwan vs Immigrants from Uruguay 1st Grade Correlation Chart

The statistical analysis conducted on geographies consisting of 298,069,082 people shows no correlation between the proportion of Immigrants from Taiwan and percentage of population with at least 1st grade education in the United States with a correlation coefficient (R) of 0.039 and weighted average of 97.9%. Similarly, the statistical analysis conducted on geographies consisting of 133,259,667 people shows a substantial positive correlation between the proportion of Immigrants from Uruguay and percentage of population with at least 1st grade education in the United States with a correlation coefficient (R) of 0.561 and weighted average of 97.6%, a difference of 0.22%.
Immigrants from Taiwan vs Immigrants from Uruguay 1st Grade

1st Grade Correlation Summary

MeasurementImmigrants from TaiwanImmigrants from Uruguay
Minimum94.2%97.1%
Maximum100.0%100.0%
Range5.8%2.9%
Mean98.1%98.5%
Median98.2%98.2%
Interquartile 25% (IQ1)97.5%97.5%
Interquartile 75% (IQ3)98.9%99.8%
Interquartile Range (IQR)1.4%2.3%
Standard Deviation (Sample)1.3%1.1%
Standard Deviation (Population)1.3%1.1%

Similar Demographics by 1st Grade

Demographics Similar to Immigrants from Taiwan by 1st Grade

In terms of 1st grade, the demographic groups most similar to Immigrants from Taiwan are Black/African American (97.9%, a difference of 0.0%), Paraguayan (97.9%, a difference of 0.0%), Mongolian (97.9%, a difference of 0.0%), Hawaiian (97.9%, a difference of 0.0%), and Immigrants from Kenya (97.8%, a difference of 0.010%).
DemographicsRating | Rank1st Grade
Paiute
36.5
/100
|
#186
Fair
97.9%
Pakistanis
35.8
/100
|
#187
Fair
97.9%
Arabs
35.5
/100
|
#188
Fair
97.9%
Immigrants | Kazakhstan
34.9
/100
|
#189
Fair
97.9%
Panamanians
34.1
/100
|
#190
Fair
97.9%
Blacks/African Americans
30.7
/100
|
#191
Fair
97.9%
Paraguayans
30.2
/100
|
#192
Fair
97.9%
Immigrants | Taiwan
29.4
/100
|
#193
Fair
97.9%
Mongolians
29.2
/100
|
#194
Fair
97.9%
Hawaiians
28.8
/100
|
#195
Fair
97.9%
Immigrants | Kenya
26.3
/100
|
#196
Fair
97.8%
Guamanians/Chamorros
26.2
/100
|
#197
Fair
97.8%
Yuman
24.4
/100
|
#198
Fair
97.8%
Tohono O'odham
23.2
/100
|
#199
Fair
97.8%
Immigrants | Egypt
22.6
/100
|
#200
Fair
97.8%

Demographics Similar to Immigrants from Uruguay by 1st Grade

In terms of 1st grade, the demographic groups most similar to Immigrants from Uruguay are Puerto Rican (97.7%, a difference of 0.010%), Immigrants from Pakistan (97.6%, a difference of 0.010%), Colombian (97.6%, a difference of 0.010%), Immigrants from Malaysia (97.6%, a difference of 0.010%), and Immigrants from Western Asia (97.6%, a difference of 0.010%).
DemographicsRating | Rank1st Grade
Immigrants | Nepal
4.0
/100
|
#225
Tragic
97.7%
Sudanese
3.7
/100
|
#226
Tragic
97.7%
Sierra Leoneans
3.6
/100
|
#227
Tragic
97.7%
Sub-Saharan Africans
3.6
/100
|
#228
Tragic
97.7%
Immigrants | Costa Rica
3.5
/100
|
#229
Tragic
97.7%
Senegalese
3.5
/100
|
#230
Tragic
97.7%
Puerto Ricans
3.0
/100
|
#231
Tragic
97.7%
Immigrants | Uruguay
2.5
/100
|
#232
Tragic
97.6%
Immigrants | Pakistan
2.2
/100
|
#233
Tragic
97.6%
Colombians
2.2
/100
|
#234
Tragic
97.6%
Immigrants | Malaysia
2.1
/100
|
#235
Tragic
97.6%
Immigrants | Western Asia
2.1
/100
|
#236
Tragic
97.6%
U.S. Virgin Islanders
1.9
/100
|
#237
Tragic
97.6%
Nigerians
1.8
/100
|
#238
Tragic
97.6%
Immigrants | Eastern Asia
1.6
/100
|
#239
Tragic
97.6%