Immigrants from Syria vs Immigrants from Argentina 4th Grade
COMPARE
Immigrants from Syria
Immigrants from Argentina
4th Grade
4th Grade Comparison
Immigrants from Syria
Immigrants from Argentina
97.2%
4TH GRADE
5.0/ 100
METRIC RATING
224th/ 347
METRIC RANK
97.5%
4TH GRADE
34.6/ 100
METRIC RATING
188th/ 347
METRIC RANK
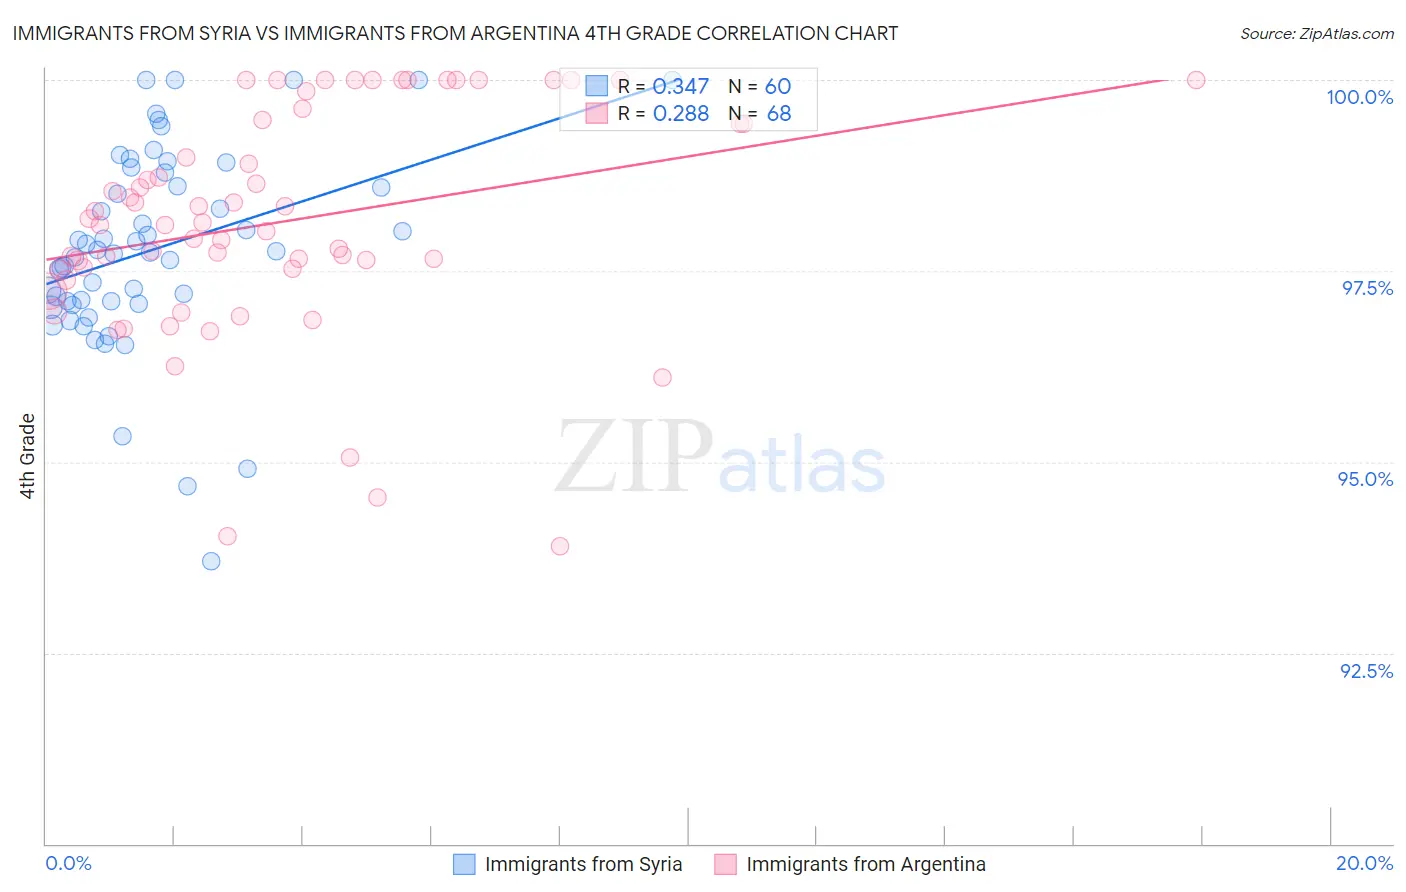
Immigrants from Syria vs Immigrants from Argentina 4th Grade Correlation Chart
The statistical analysis conducted on geographies consisting of 174,108,374 people shows a mild positive correlation between the proportion of Immigrants from Syria and percentage of population with at least 4th grade education in the United States with a correlation coefficient (R) of 0.347 and weighted average of 97.2%. Similarly, the statistical analysis conducted on geographies consisting of 264,434,317 people shows a weak positive correlation between the proportion of Immigrants from Argentina and percentage of population with at least 4th grade education in the United States with a correlation coefficient (R) of 0.288 and weighted average of 97.5%, a difference of 0.22%.
4th Grade Correlation Summary
| Measurement | Immigrants from Syria | Immigrants from Argentina |
| Minimum | 93.7% | 93.9% |
| Maximum | 100.0% | 100.0% |
| Range | 6.3% | 6.1% |
| Mean | 97.8% | 98.1% |
| Median | 97.7% | 98.1% |
| Interquartile 25% (IQ1) | 97.1% | 97.5% |
| Interquartile 75% (IQ3) | 98.7% | 99.5% |
| Interquartile Range (IQR) | 1.6% | 1.9% |
| Standard Deviation (Sample) | 1.3% | 1.5% |
| Standard Deviation (Population) | 1.3% | 1.5% |
Similar Demographics by 4th Grade
Demographics Similar to Immigrants from Syria by 4th Grade
In terms of 4th grade, the demographic groups most similar to Immigrants from Syria are Immigrants from Lebanon (97.3%, a difference of 0.0%), Immigrants from Sudan (97.2%, a difference of 0.0%), South American Indian (97.3%, a difference of 0.010%), Immigrants from Panama (97.3%, a difference of 0.010%), and Immigrants from Iraq (97.2%, a difference of 0.010%).
| Demographics | Rating | Rank | 4th Grade |
| Sierra Leoneans | 6.5 /100 | #217 | Tragic 97.3% |
| Iraqis | 6.3 /100 | #218 | Tragic 97.3% |
| Tongans | 5.8 /100 | #219 | Tragic 97.3% |
| South American Indians | 5.5 /100 | #220 | Tragic 97.3% |
| Immigrants | Panama | 5.4 /100 | #221 | Tragic 97.3% |
| Immigrants | Lebanon | 5.1 /100 | #222 | Tragic 97.3% |
| Immigrants | Sudan | 5.0 /100 | #223 | Tragic 97.2% |
| Immigrants | Syria | 5.0 /100 | #224 | Tragic 97.2% |
| Immigrants | Iraq | 4.6 /100 | #225 | Tragic 97.2% |
| Bahamians | 3.8 /100 | #226 | Tragic 97.2% |
| Immigrants | Pakistan | 3.7 /100 | #227 | Tragic 97.2% |
| Sub-Saharan Africans | 3.6 /100 | #228 | Tragic 97.2% |
| Liberians | 3.6 /100 | #229 | Tragic 97.2% |
| Uruguayans | 3.5 /100 | #230 | Tragic 97.2% |
| Immigrants | Malaysia | 3.4 /100 | #231 | Tragic 97.2% |
Demographics Similar to Immigrants from Argentina by 4th Grade
In terms of 4th grade, the demographic groups most similar to Immigrants from Argentina are Immigrants from Kenya (97.5%, a difference of 0.0%), Dutch West Indian (97.5%, a difference of 0.0%), Mongolian (97.5%, a difference of 0.0%), Pakistani (97.5%, a difference of 0.010%), and Panamanian (97.4%, a difference of 0.010%).
| Demographics | Rating | Rank | 4th Grade |
| Immigrants | Taiwan | 41.5 /100 | #181 | Average 97.5% |
| Spanish Americans | 39.3 /100 | #182 | Fair 97.5% |
| Argentineans | 39.0 /100 | #183 | Fair 97.5% |
| Pakistanis | 36.2 /100 | #184 | Fair 97.5% |
| Immigrants | Kenya | 35.8 /100 | #185 | Fair 97.5% |
| Dutch West Indians | 35.8 /100 | #186 | Fair 97.5% |
| Mongolians | 34.7 /100 | #187 | Fair 97.5% |
| Immigrants | Argentina | 34.6 /100 | #188 | Fair 97.5% |
| Panamanians | 31.9 /100 | #189 | Fair 97.4% |
| Blacks/African Americans | 31.1 /100 | #190 | Fair 97.4% |
| Navajo | 30.7 /100 | #191 | Fair 97.4% |
| Immigrants | Ukraine | 30.1 /100 | #192 | Fair 97.4% |
| Immigrants | Egypt | 30.1 /100 | #193 | Fair 97.4% |
| Portuguese | 29.2 /100 | #194 | Fair 97.4% |
| Paraguayans | 28.9 /100 | #195 | Fair 97.4% |