Immigrants from Syria vs Afghan 12th Grade, No Diploma
COMPARE
Immigrants from Syria
Afghan
12th Grade, No Diploma
12th Grade, No Diploma Comparison
Immigrants from Syria
Afghans
91.1%
12TH GRADE, NO DIPLOMA
40.3/ 100
METRIC RATING
180th/ 347
METRIC RANK
90.9%
12TH GRADE, NO DIPLOMA
29.9/ 100
METRIC RATING
190th/ 347
METRIC RANK
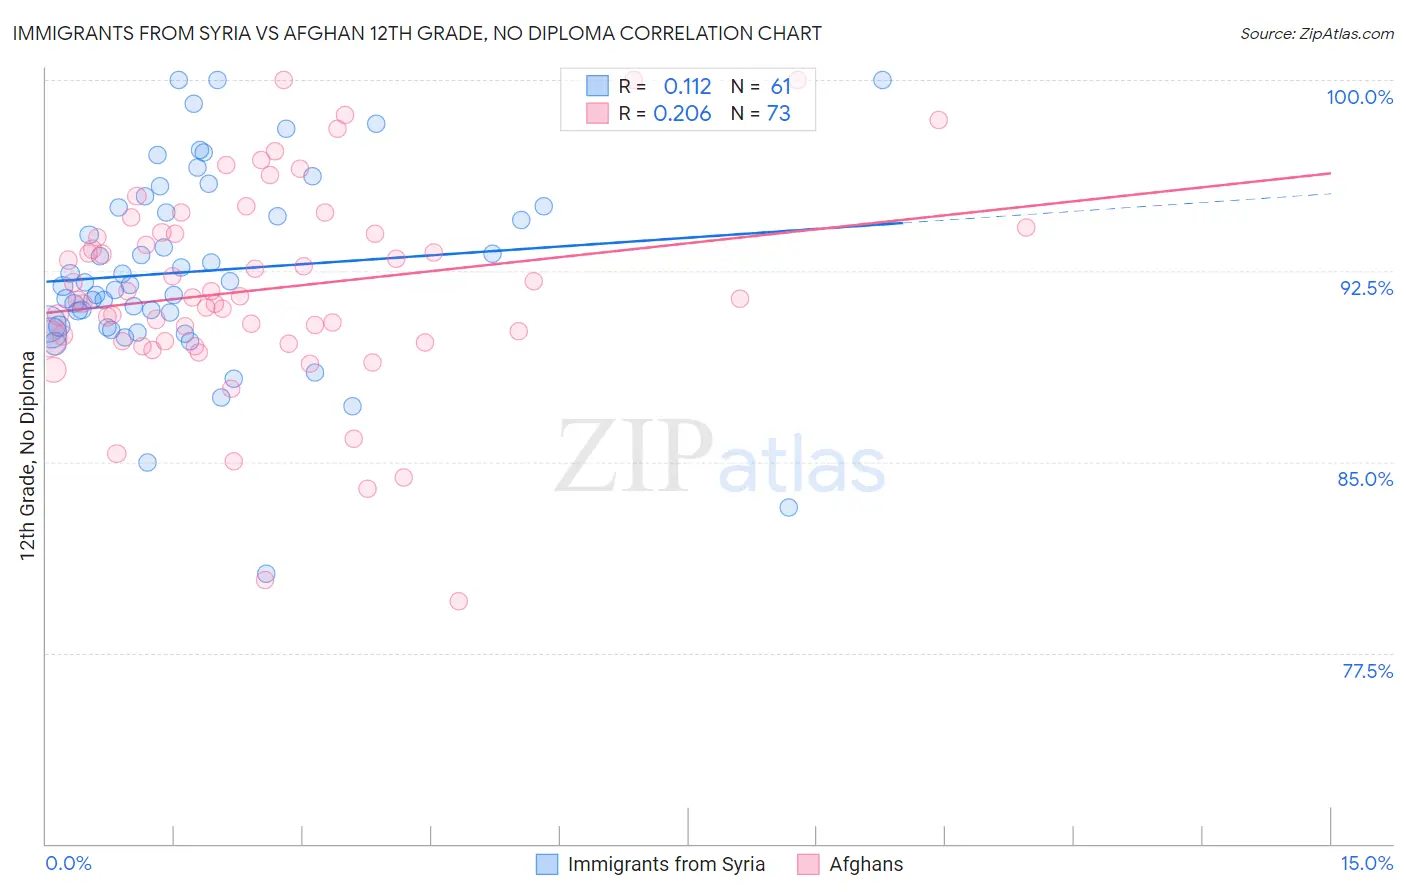
Immigrants from Syria vs Afghan 12th Grade, No Diploma Correlation Chart
The statistical analysis conducted on geographies consisting of 174,108,882 people shows a poor positive correlation between the proportion of Immigrants from Syria and percentage of population with at least 12th grade (no diploma) education in the United States with a correlation coefficient (R) of 0.112 and weighted average of 91.1%. Similarly, the statistical analysis conducted on geographies consisting of 148,850,509 people shows a weak positive correlation between the proportion of Afghans and percentage of population with at least 12th grade (no diploma) education in the United States with a correlation coefficient (R) of 0.206 and weighted average of 90.9%, a difference of 0.14%.
12th Grade, No Diploma Correlation Summary
| Measurement | Immigrants from Syria | Afghan |
| Minimum | 80.6% | 79.5% |
| Maximum | 100.0% | 100.0% |
| Range | 19.4% | 20.5% |
| Mean | 92.5% | 91.8% |
| Median | 92.0% | 91.5% |
| Interquartile 25% (IQ1) | 90.3% | 89.7% |
| Interquartile 75% (IQ3) | 95.0% | 94.0% |
| Interquartile Range (IQR) | 4.7% | 4.3% |
| Standard Deviation (Sample) | 3.8% | 4.0% |
| Standard Deviation (Population) | 3.8% | 4.0% |
Demographics Similar to Immigrants from Syria and Afghans by 12th Grade, No Diploma
In terms of 12th grade, no diploma, the demographic groups most similar to Immigrants from Syria are Guamanian/Chamorro (91.0%, a difference of 0.010%), Nonimmigrants (91.0%, a difference of 0.020%), Osage (91.0%, a difference of 0.020%), Spanish (91.1%, a difference of 0.040%), and Immigrants from Chile (91.1%, a difference of 0.040%). Similarly, the demographic groups most similar to Afghans are Moroccan (90.9%, a difference of 0.010%), Immigrants from Uganda (90.9%, a difference of 0.030%), Immigrants from Eastern Africa (90.9%, a difference of 0.030%), Potawatomi (91.0%, a difference of 0.040%), and American (91.0%, a difference of 0.040%).
| Demographics | Rating | Rank | 12th Grade, No Diploma |
| Immigrants | Western Asia | 49.0 /100 | #175 | Average 91.2% |
| Iroquois | 48.5 /100 | #176 | Average 91.1% |
| Sierra Leoneans | 47.7 /100 | #177 | Average 91.1% |
| Spanish | 43.7 /100 | #178 | Average 91.1% |
| Immigrants | Chile | 43.3 /100 | #179 | Average 91.1% |
| Immigrants | Syria | 40.3 /100 | #180 | Average 91.1% |
| Guamanians/Chamorros | 39.5 /100 | #181 | Fair 91.0% |
| Immigrants | Nonimmigrants | 38.8 /100 | #182 | Fair 91.0% |
| Osage | 38.3 /100 | #183 | Fair 91.0% |
| Spaniards | 36.2 /100 | #184 | Fair 91.0% |
| Sudanese | 34.4 /100 | #185 | Fair 91.0% |
| Ethiopians | 33.9 /100 | #186 | Fair 91.0% |
| Potawatomi | 32.9 /100 | #187 | Fair 91.0% |
| Americans | 32.6 /100 | #188 | Fair 91.0% |
| Immigrants | Uganda | 31.6 /100 | #189 | Fair 90.9% |
| Afghans | 29.9 /100 | #190 | Fair 90.9% |
| Moroccans | 28.8 /100 | #191 | Fair 90.9% |
| Immigrants | Eastern Africa | 27.7 /100 | #192 | Fair 90.9% |
| Immigrants | Ethiopia | 27.2 /100 | #193 | Fair 90.9% |
| Immigrants | Oceania | 26.0 /100 | #194 | Fair 90.9% |
| Koreans | 24.5 /100 | #195 | Fair 90.8% |