Immigrants from Switzerland vs French 2nd Grade
COMPARE
Immigrants from Switzerland
French
2nd Grade
2nd Grade Comparison
Immigrants from Switzerland
French
98.1%
2ND GRADE
97.3/ 100
METRIC RATING
108th/ 347
METRIC RANK
98.5%
2ND GRADE
100.0/ 100
METRIC RATING
29th/ 347
METRIC RANK
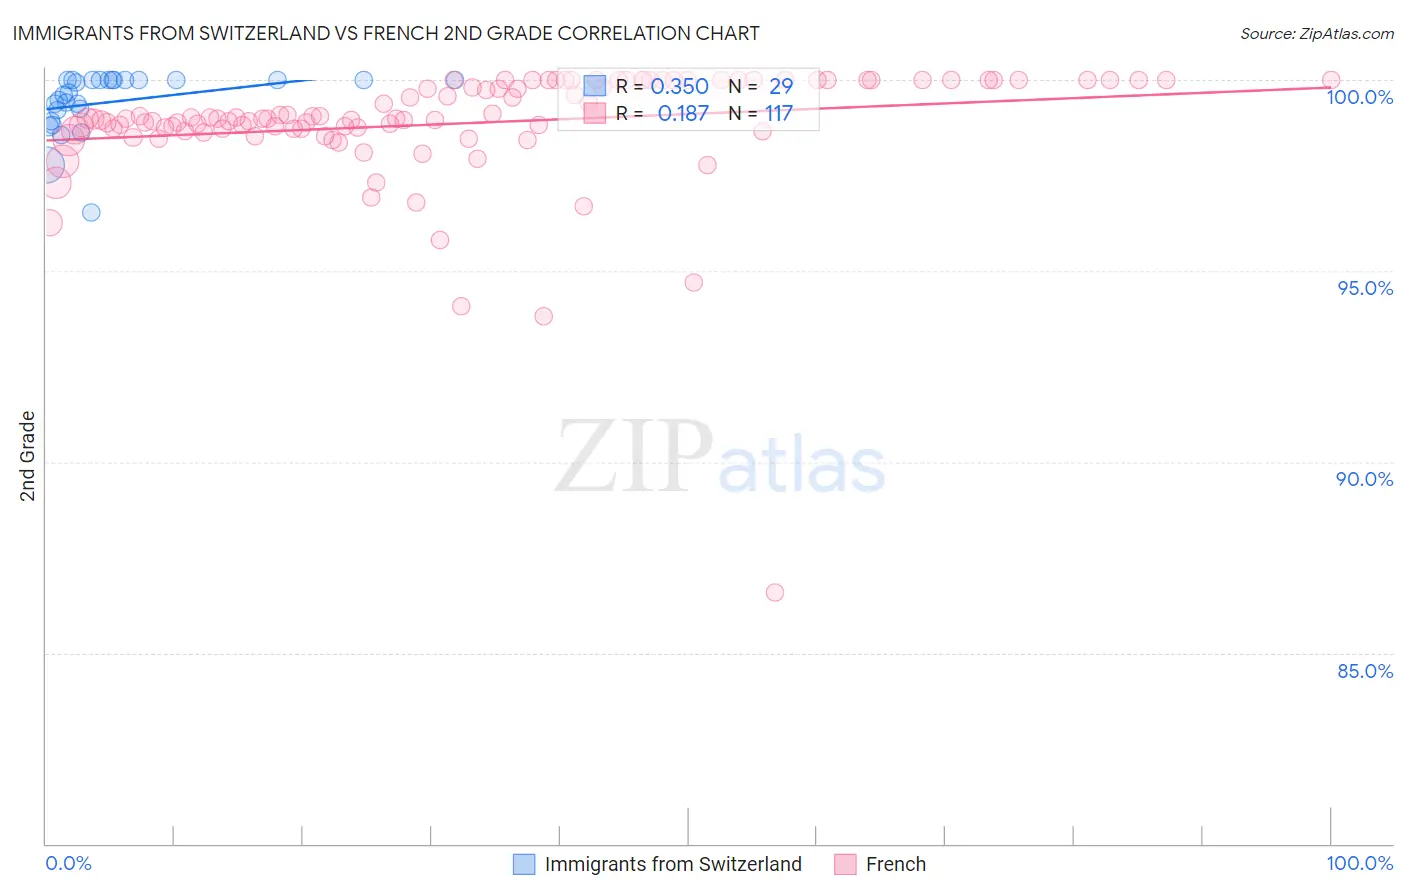
Immigrants from Switzerland vs French 2nd Grade Correlation Chart
The statistical analysis conducted on geographies consisting of 148,082,451 people shows a mild positive correlation between the proportion of Immigrants from Switzerland and percentage of population with at least 2nd grade education in the United States with a correlation coefficient (R) of 0.350 and weighted average of 98.1%. Similarly, the statistical analysis conducted on geographies consisting of 572,427,269 people shows a poor positive correlation between the proportion of French and percentage of population with at least 2nd grade education in the United States with a correlation coefficient (R) of 0.187 and weighted average of 98.5%, a difference of 0.38%.
2nd Grade Correlation Summary
| Measurement | Immigrants from Switzerland | French |
| Minimum | 96.5% | 86.6% |
| Maximum | 100.0% | 100.0% |
| Range | 3.5% | 13.4% |
| Mean | 99.4% | 98.9% |
| Median | 99.7% | 99.0% |
| Interquartile 25% (IQ1) | 99.1% | 98.7% |
| Interquartile 75% (IQ3) | 100.0% | 100.0% |
| Interquartile Range (IQR) | 0.93% | 1.3% |
| Standard Deviation (Sample) | 0.80% | 1.6% |
| Standard Deviation (Population) | 0.79% | 1.6% |
Similar Demographics by 2nd Grade
Demographics Similar to Immigrants from Switzerland by 2nd Grade
In terms of 2nd grade, the demographic groups most similar to Immigrants from Switzerland are Bhutanese (98.1%, a difference of 0.0%), German Russian (98.1%, a difference of 0.0%), Basque (98.1%, a difference of 0.0%), Pima (98.2%, a difference of 0.010%), and Turkish (98.2%, a difference of 0.010%).
| Demographics | Rating | Rank | 2nd Grade |
| Puget Sound Salish | 98.0 /100 | #101 | Exceptional 98.2% |
| Cree | 98.0 /100 | #102 | Exceptional 98.2% |
| Pima | 97.6 /100 | #103 | Exceptional 98.2% |
| Turks | 97.6 /100 | #104 | Exceptional 98.2% |
| Yugoslavians | 97.5 /100 | #105 | Exceptional 98.2% |
| Bhutanese | 97.5 /100 | #106 | Exceptional 98.1% |
| German Russians | 97.4 /100 | #107 | Exceptional 98.1% |
| Immigrants | Switzerland | 97.3 /100 | #108 | Exceptional 98.1% |
| Basques | 97.2 /100 | #109 | Exceptional 98.1% |
| Immigrants | Singapore | 97.0 /100 | #110 | Exceptional 98.1% |
| Immigrants | Czechoslovakia | 96.9 /100 | #111 | Exceptional 98.1% |
| Colville | 96.6 /100 | #112 | Exceptional 98.1% |
| Immigrants | Norway | 96.5 /100 | #113 | Exceptional 98.1% |
| Immigrants | Latvia | 96.4 /100 | #114 | Exceptional 98.1% |
| Iranians | 95.9 /100 | #115 | Exceptional 98.1% |
Demographics Similar to French by 2nd Grade
In terms of 2nd grade, the demographic groups most similar to French are Arapaho (98.5%, a difference of 0.0%), Welsh (98.5%, a difference of 0.010%), Croatian (98.5%, a difference of 0.010%), European (98.5%, a difference of 0.010%), and Czech (98.5%, a difference of 0.010%).
| Demographics | Rating | Rank | 2nd Grade |
| Poles | 100.0 /100 | #22 | Exceptional 98.5% |
| Danes | 100.0 /100 | #23 | Exceptional 98.5% |
| Pennsylvania Germans | 100.0 /100 | #24 | Exceptional 98.5% |
| Scotch-Irish | 100.0 /100 | #25 | Exceptional 98.5% |
| Welsh | 100.0 /100 | #26 | Exceptional 98.5% |
| Croatians | 100.0 /100 | #27 | Exceptional 98.5% |
| Arapaho | 100.0 /100 | #28 | Exceptional 98.5% |
| French | 100.0 /100 | #29 | Exceptional 98.5% |
| Europeans | 100.0 /100 | #30 | Exceptional 98.5% |
| Czechs | 100.0 /100 | #31 | Exceptional 98.5% |
| French Canadians | 100.0 /100 | #32 | Exceptional 98.5% |
| Scandinavians | 100.0 /100 | #33 | Exceptional 98.5% |
| Chinese | 100.0 /100 | #34 | Exceptional 98.5% |
| Swiss | 100.0 /100 | #35 | Exceptional 98.5% |
| British | 100.0 /100 | #36 | Exceptional 98.5% |