Immigrants from Sweden vs Syrian Nursery School
COMPARE
Immigrants from Sweden
Syrian
Nursery School
Nursery School Comparison
Immigrants from Sweden
Syrians
98.3%
NURSERY SCHOOL
99.1/ 100
METRIC RATING
85th/ 347
METRIC RANK
98.2%
NURSERY SCHOOL
93.9/ 100
METRIC RATING
123rd/ 347
METRIC RANK
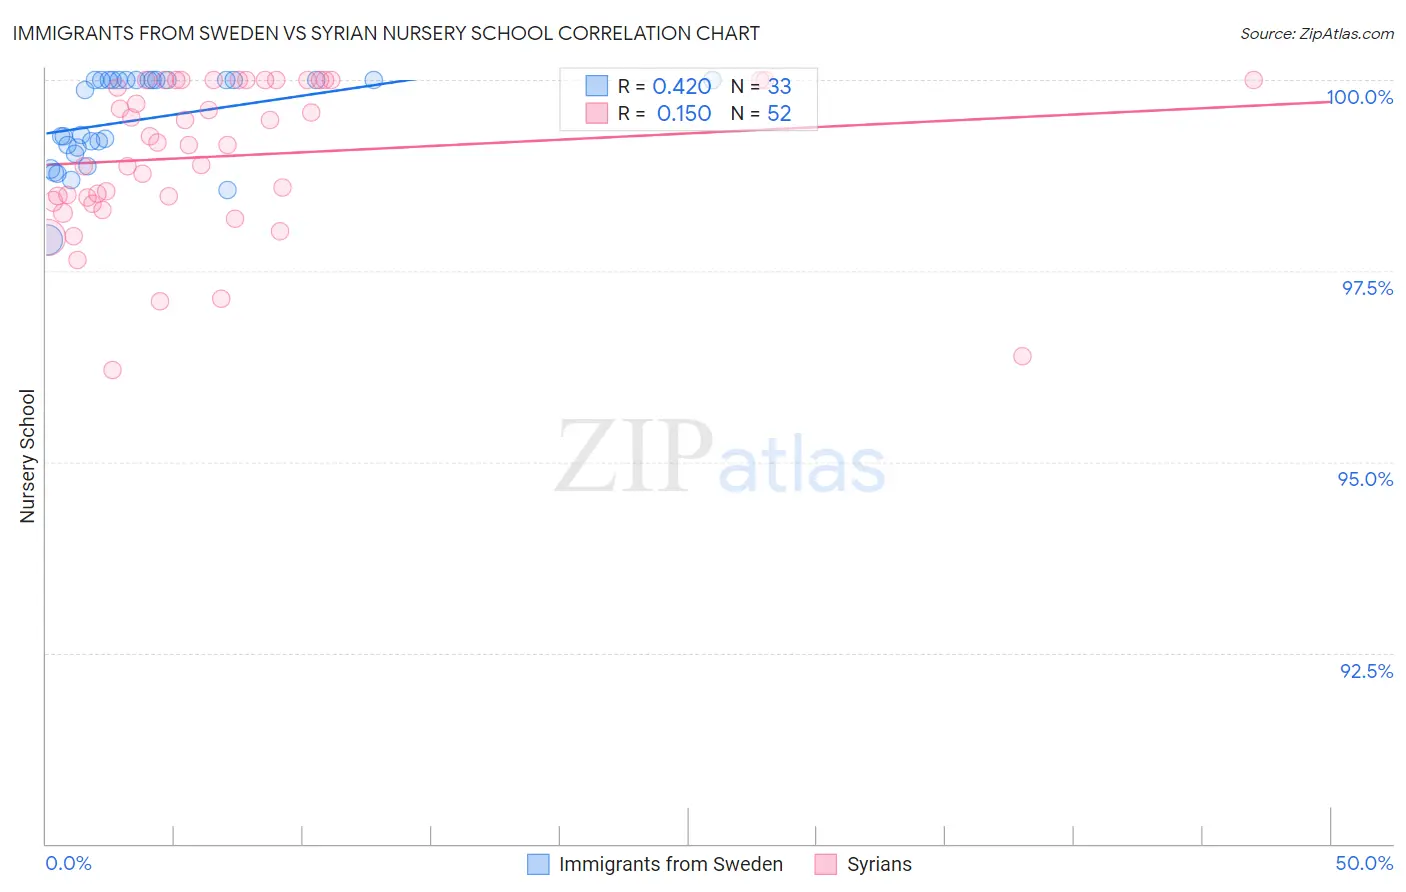
Immigrants from Sweden vs Syrian Nursery School Correlation Chart
The statistical analysis conducted on geographies consisting of 164,737,092 people shows a moderate positive correlation between the proportion of Immigrants from Sweden and percentage of population with at least nursery school education in the United States with a correlation coefficient (R) of 0.420 and weighted average of 98.3%. Similarly, the statistical analysis conducted on geographies consisting of 266,306,307 people shows a poor positive correlation between the proportion of Syrians and percentage of population with at least nursery school education in the United States with a correlation coefficient (R) of 0.150 and weighted average of 98.2%, a difference of 0.15%.
Nursery School Correlation Summary
| Measurement | Immigrants from Sweden | Syrian |
| Minimum | 97.9% | 96.2% |
| Maximum | 100.0% | 100.0% |
| Range | 2.1% | 3.8% |
| Mean | 99.5% | 99.0% |
| Median | 99.9% | 99.2% |
| Interquartile 25% (IQ1) | 99.1% | 98.4% |
| Interquartile 75% (IQ3) | 100.0% | 100.0% |
| Interquartile Range (IQR) | 0.92% | 1.6% |
| Standard Deviation (Sample) | 0.58% | 0.99% |
| Standard Deviation (Population) | 0.58% | 0.98% |
Similar Demographics by Nursery School
Demographics Similar to Immigrants from Sweden by Nursery School
In terms of nursery school, the demographic groups most similar to Immigrants from Sweden are Osage (98.3%, a difference of 0.0%), Immigrants from Denmark (98.3%, a difference of 0.0%), Icelander (98.3%, a difference of 0.010%), Potawatomi (98.3%, a difference of 0.010%), and Immigrants from Australia (98.3%, a difference of 0.010%).
| Demographics | Rating | Rank | Nursery School |
| Delaware | 99.3 /100 | #78 | Exceptional 98.3% |
| Immigrants | Belgium | 99.3 /100 | #79 | Exceptional 98.3% |
| Shoshone | 99.3 /100 | #80 | Exceptional 98.3% |
| Icelanders | 99.2 /100 | #81 | Exceptional 98.3% |
| Potawatomi | 99.2 /100 | #82 | Exceptional 98.3% |
| Osage | 99.1 /100 | #83 | Exceptional 98.3% |
| Immigrants | Denmark | 99.1 /100 | #84 | Exceptional 98.3% |
| Immigrants | Sweden | 99.1 /100 | #85 | Exceptional 98.3% |
| Immigrants | Australia | 99.0 /100 | #86 | Exceptional 98.3% |
| Hopi | 98.9 /100 | #87 | Exceptional 98.3% |
| Ukrainians | 98.9 /100 | #88 | Exceptional 98.3% |
| Immigrants | South Africa | 98.8 /100 | #89 | Exceptional 98.3% |
| Immigrants | Western Europe | 98.8 /100 | #90 | Exceptional 98.3% |
| Zimbabweans | 98.8 /100 | #91 | Exceptional 98.3% |
| Macedonians | 98.7 /100 | #92 | Exceptional 98.3% |
Demographics Similar to Syrians by Nursery School
In terms of nursery school, the demographic groups most similar to Syrians are Immigrants from Zimbabwe (98.2%, a difference of 0.0%), Immigrants from Japan (98.2%, a difference of 0.0%), Lebanese (98.2%, a difference of 0.0%), Iroquois (98.2%, a difference of 0.0%), and Menominee (98.2%, a difference of 0.0%).
| Demographics | Rating | Rank | Nursery School |
| Spanish | 95.8 /100 | #116 | Exceptional 98.2% |
| Immigrants | France | 95.6 /100 | #117 | Exceptional 98.2% |
| Yugoslavians | 95.4 /100 | #118 | Exceptional 98.2% |
| Thais | 95.0 /100 | #119 | Exceptional 98.2% |
| Okinawans | 94.5 /100 | #120 | Exceptional 98.2% |
| Immigrants | Zimbabwe | 94.2 /100 | #121 | Exceptional 98.2% |
| Immigrants | Japan | 94.0 /100 | #122 | Exceptional 98.2% |
| Syrians | 93.9 /100 | #123 | Exceptional 98.2% |
| Lebanese | 93.8 /100 | #124 | Exceptional 98.2% |
| Iroquois | 93.7 /100 | #125 | Exceptional 98.2% |
| Menominee | 93.6 /100 | #126 | Exceptional 98.2% |
| Immigrants | Saudi Arabia | 93.4 /100 | #127 | Exceptional 98.2% |
| Immigrants | Serbia | 92.4 /100 | #128 | Exceptional 98.2% |
| Cambodians | 91.4 /100 | #129 | Exceptional 98.2% |
| Immigrants | Croatia | 91.4 /100 | #130 | Exceptional 98.2% |