Immigrants from Sweden vs Immigrants from Bahamas 8th Grade
COMPARE
Immigrants from Sweden
Immigrants from Bahamas
8th Grade
8th Grade Comparison
Immigrants from Sweden
Immigrants from Bahamas
96.4%
8TH GRADE
98.9/ 100
METRIC RATING
90th/ 347
METRIC RANK
95.5%
8TH GRADE
16.7/ 100
METRIC RATING
205th/ 347
METRIC RANK
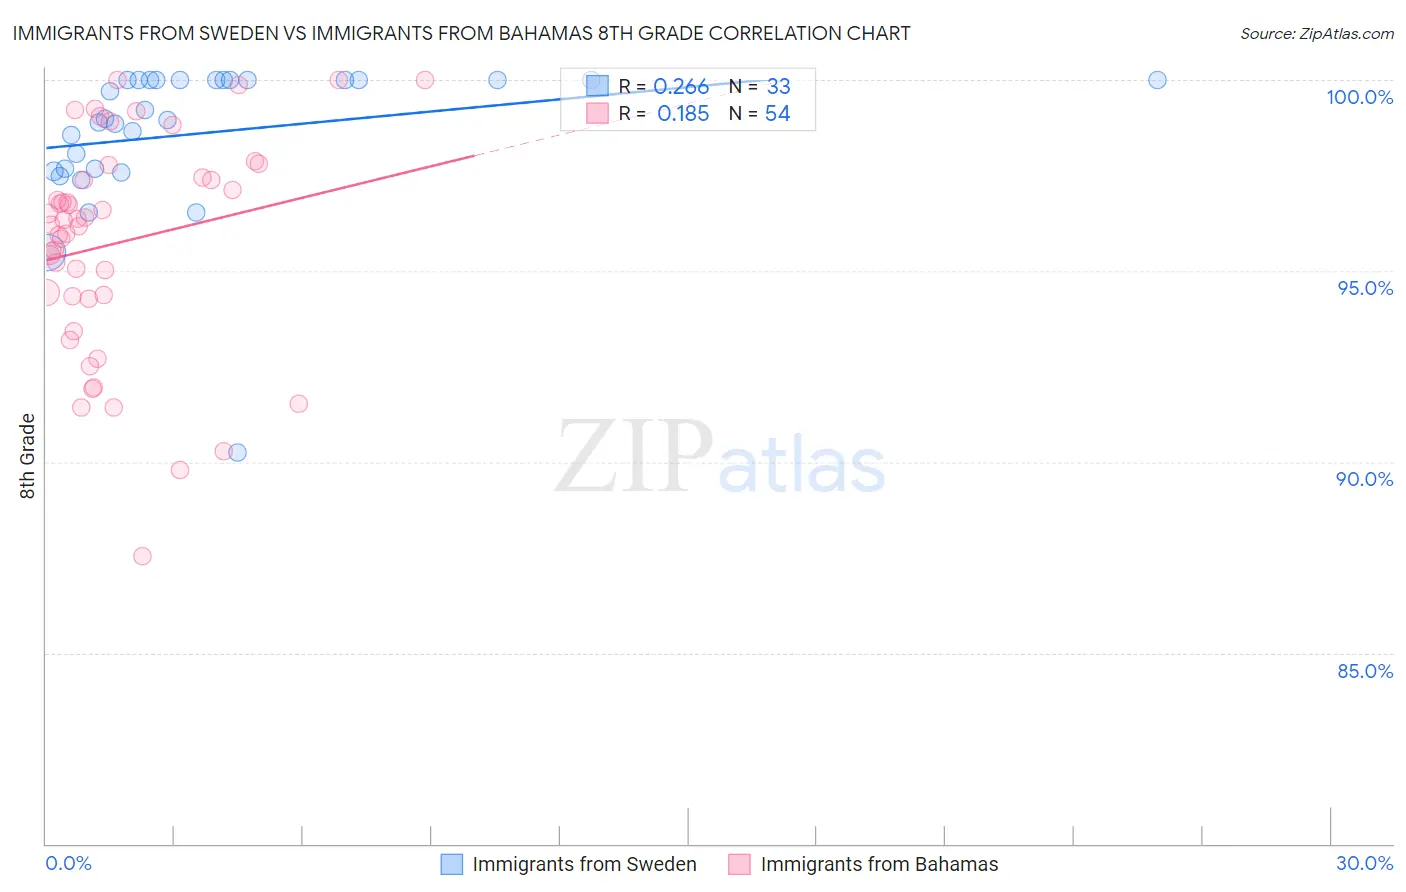
Immigrants from Sweden vs Immigrants from Bahamas 8th Grade Correlation Chart
The statistical analysis conducted on geographies consisting of 164,737,275 people shows a weak positive correlation between the proportion of Immigrants from Sweden and percentage of population with at least 8th grade education in the United States with a correlation coefficient (R) of 0.266 and weighted average of 96.4%. Similarly, the statistical analysis conducted on geographies consisting of 104,666,801 people shows a poor positive correlation between the proportion of Immigrants from Bahamas and percentage of population with at least 8th grade education in the United States with a correlation coefficient (R) of 0.185 and weighted average of 95.5%, a difference of 0.99%.
8th Grade Correlation Summary
| Measurement | Immigrants from Sweden | Immigrants from Bahamas |
| Minimum | 90.2% | 87.5% |
| Maximum | 100.0% | 100.0% |
| Range | 9.8% | 12.5% |
| Mean | 98.6% | 95.7% |
| Median | 99.0% | 96.3% |
| Interquartile 25% (IQ1) | 97.6% | 94.3% |
| Interquartile 75% (IQ3) | 100.0% | 97.4% |
| Interquartile Range (IQR) | 2.4% | 3.1% |
| Standard Deviation (Sample) | 2.0% | 2.8% |
| Standard Deviation (Population) | 1.9% | 2.8% |
Similar Demographics by 8th Grade
Demographics Similar to Immigrants from Sweden by 8th Grade
In terms of 8th grade, the demographic groups most similar to Immigrants from Sweden are Chickasaw (96.4%, a difference of 0.0%), Thai (96.4%, a difference of 0.0%), Menominee (96.4%, a difference of 0.0%), Immigrants from Denmark (96.4%, a difference of 0.0%), and Immigrants from Singapore (96.4%, a difference of 0.010%).
| Demographics | Rating | Rank | 8th Grade |
| Icelanders | 99.2 /100 | #83 | Exceptional 96.5% |
| Immigrants | Belgium | 99.1 /100 | #84 | Exceptional 96.5% |
| Immigrants | South Africa | 99.1 /100 | #85 | Exceptional 96.5% |
| Cherokee | 99.0 /100 | #86 | Exceptional 96.5% |
| Immigrants | Australia | 99.0 /100 | #87 | Exceptional 96.5% |
| Immigrants | Western Europe | 99.0 /100 | #88 | Exceptional 96.4% |
| Chickasaw | 98.9 /100 | #89 | Exceptional 96.4% |
| Immigrants | Sweden | 98.9 /100 | #90 | Exceptional 96.4% |
| Thais | 98.9 /100 | #91 | Exceptional 96.4% |
| Menominee | 98.9 /100 | #92 | Exceptional 96.4% |
| Immigrants | Denmark | 98.8 /100 | #93 | Exceptional 96.4% |
| Immigrants | Singapore | 98.8 /100 | #94 | Exceptional 96.4% |
| German Russians | 98.8 /100 | #95 | Exceptional 96.4% |
| Potawatomi | 98.7 /100 | #96 | Exceptional 96.4% |
| Osage | 98.7 /100 | #97 | Exceptional 96.4% |
Demographics Similar to Immigrants from Bahamas by 8th Grade
In terms of 8th grade, the demographic groups most similar to Immigrants from Bahamas are Hawaiian (95.5%, a difference of 0.0%), Comanche (95.5%, a difference of 0.0%), Moroccan (95.5%, a difference of 0.010%), Immigrants from Sudan (95.5%, a difference of 0.020%), and Apache (95.5%, a difference of 0.030%).
| Demographics | Rating | Rank | 8th Grade |
| Paraguayans | 22.6 /100 | #198 | Fair 95.5% |
| Immigrants | Northern Africa | 22.5 /100 | #199 | Fair 95.5% |
| Argentineans | 22.2 /100 | #200 | Fair 95.5% |
| Immigrants | Argentina | 20.6 /100 | #201 | Fair 95.5% |
| Apache | 19.4 /100 | #202 | Poor 95.5% |
| Moroccans | 17.4 /100 | #203 | Poor 95.5% |
| Hawaiians | 16.7 /100 | #204 | Poor 95.5% |
| Immigrants | Bahamas | 16.7 /100 | #205 | Poor 95.5% |
| Comanche | 16.3 /100 | #206 | Poor 95.5% |
| Immigrants | Sudan | 15.1 /100 | #207 | Poor 95.5% |
| Portuguese | 14.3 /100 | #208 | Poor 95.5% |
| Immigrants | Lebanon | 13.7 /100 | #209 | Poor 95.4% |
| Africans | 13.6 /100 | #210 | Poor 95.4% |
| Immigrants | Morocco | 12.4 /100 | #211 | Poor 95.4% |
| Immigrants | Pakistan | 9.7 /100 | #212 | Tragic 95.4% |