Immigrants from Sweden vs Celtic Professional Degree
COMPARE
Immigrants from Sweden
Celtic
Professional Degree
Professional Degree Comparison
Immigrants from Sweden
Celtics
6.7%
PROFESSIONAL DEGREE
100.0/ 100
METRIC RATING
16th/ 347
METRIC RANK
4.4%
PROFESSIONAL DEGREE
47.6/ 100
METRIC RATING
177th/ 347
METRIC RANK
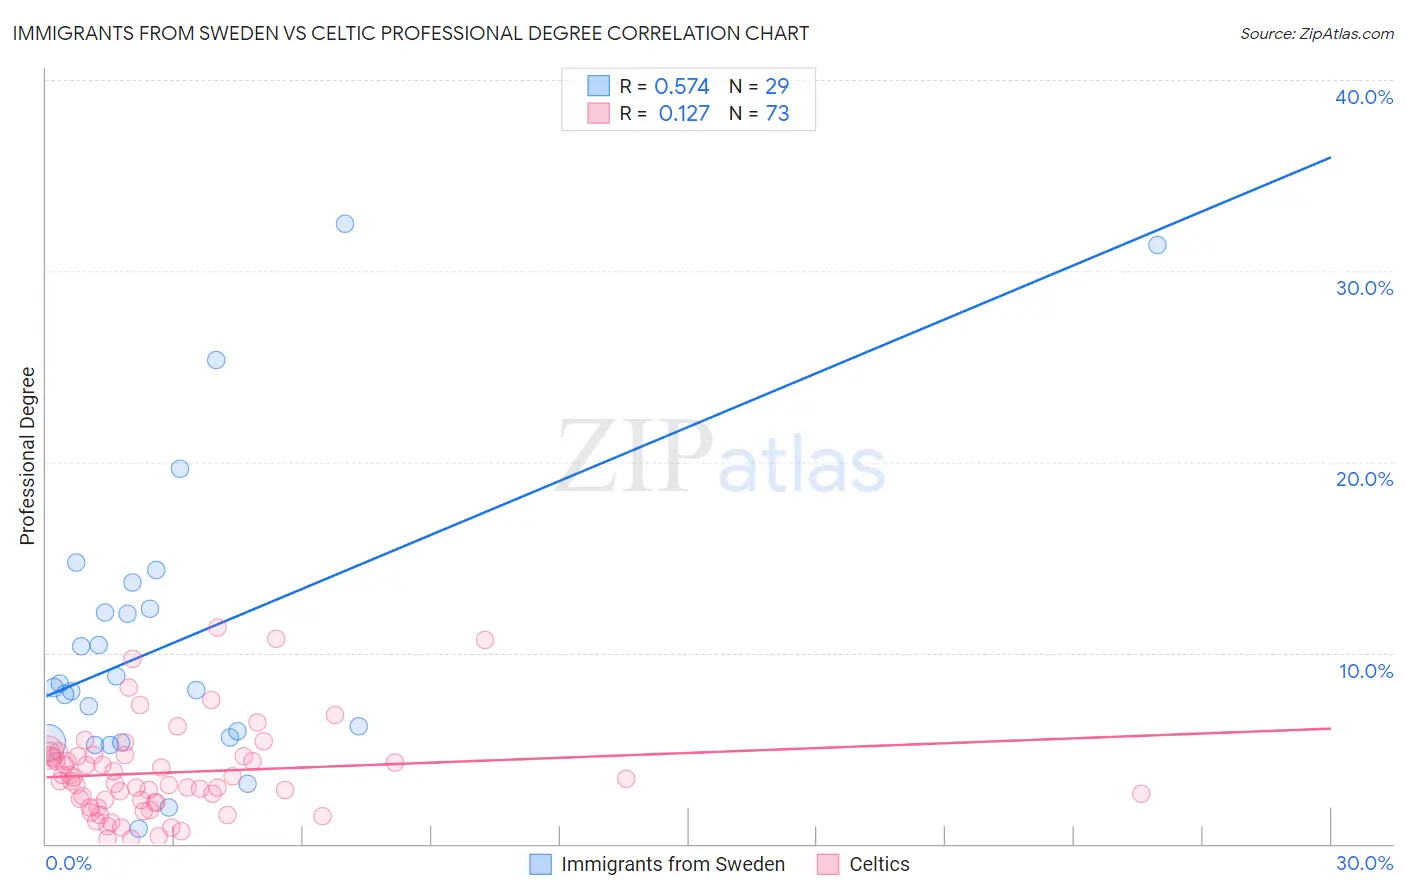
Immigrants from Sweden vs Celtic Professional Degree Correlation Chart
The statistical analysis conducted on geographies consisting of 164,659,960 people shows a substantial positive correlation between the proportion of Immigrants from Sweden and percentage of population with at least professional degree education in the United States with a correlation coefficient (R) of 0.574 and weighted average of 6.7%. Similarly, the statistical analysis conducted on geographies consisting of 168,640,863 people shows a poor positive correlation between the proportion of Celtics and percentage of population with at least professional degree education in the United States with a correlation coefficient (R) of 0.127 and weighted average of 4.4%, a difference of 52.6%.
Professional Degree Correlation Summary
| Measurement | Immigrants from Sweden | Celtic |
| Minimum | 0.79% | 0.25% |
| Maximum | 32.5% | 11.4% |
| Range | 31.7% | 11.1% |
| Mean | 10.7% | 3.7% |
| Median | 8.2% | 3.3% |
| Interquartile 25% (IQ1) | 5.5% | 2.2% |
| Interquartile 75% (IQ3) | 13.0% | 4.6% |
| Interquartile Range (IQR) | 7.5% | 2.5% |
| Standard Deviation (Sample) | 7.8% | 2.4% |
| Standard Deviation (Population) | 7.7% | 2.4% |
Similar Demographics by Professional Degree
Demographics Similar to Immigrants from Sweden by Professional Degree
In terms of professional degree, the demographic groups most similar to Immigrants from Sweden are Immigrants from China (6.7%, a difference of 0.45%), Immigrants from France (6.8%, a difference of 1.5%), Immigrants from Eastern Asia (6.6%, a difference of 2.0%), Soviet Union (6.6%, a difference of 2.0%), and Indian (Asian) (6.5%, a difference of 2.7%).
| Demographics | Rating | Rank | Professional Degree |
| Immigrants | Taiwan | 100.0 /100 | #9 | Exceptional 7.1% |
| Immigrants | Belgium | 100.0 /100 | #10 | Exceptional 7.0% |
| Cypriots | 100.0 /100 | #11 | Exceptional 6.9% |
| Israelis | 100.0 /100 | #12 | Exceptional 6.9% |
| Immigrants | Australia | 100.0 /100 | #13 | Exceptional 6.9% |
| Immigrants | France | 100.0 /100 | #14 | Exceptional 6.8% |
| Immigrants | China | 100.0 /100 | #15 | Exceptional 6.7% |
| Immigrants | Sweden | 100.0 /100 | #16 | Exceptional 6.7% |
| Immigrants | Eastern Asia | 100.0 /100 | #17 | Exceptional 6.6% |
| Soviet Union | 100.0 /100 | #18 | Exceptional 6.6% |
| Indians (Asian) | 100.0 /100 | #19 | Exceptional 6.5% |
| Immigrants | Denmark | 100.0 /100 | #20 | Exceptional 6.4% |
| Immigrants | Hong Kong | 100.0 /100 | #21 | Exceptional 6.4% |
| Immigrants | Japan | 100.0 /100 | #22 | Exceptional 6.4% |
| Russians | 100.0 /100 | #23 | Exceptional 6.3% |
Demographics Similar to Celtics by Professional Degree
In terms of professional degree, the demographic groups most similar to Celtics are Immigrants from Costa Rica (4.4%, a difference of 0.13%), Immigrants from Kenya (4.4%, a difference of 0.24%), Immigrants from Peru (4.4%, a difference of 0.25%), Kenyan (4.4%, a difference of 0.35%), and Irish (4.4%, a difference of 0.35%).
| Demographics | Rating | Rank | Professional Degree |
| Immigrants | Zaire | 57.4 /100 | #170 | Average 4.5% |
| Immigrants | Bangladesh | 56.0 /100 | #171 | Average 4.4% |
| Spaniards | 52.0 /100 | #172 | Average 4.4% |
| English | 50.1 /100 | #173 | Average 4.4% |
| Kenyans | 50.0 /100 | #174 | Average 4.4% |
| Irish | 50.0 /100 | #175 | Average 4.4% |
| Immigrants | Peru | 49.3 /100 | #176 | Average 4.4% |
| Celtics | 47.6 /100 | #177 | Average 4.4% |
| Immigrants | Costa Rica | 46.7 /100 | #178 | Average 4.4% |
| Immigrants | Kenya | 45.9 /100 | #179 | Average 4.4% |
| Czechs | 44.9 /100 | #180 | Average 4.4% |
| Danes | 43.5 /100 | #181 | Average 4.4% |
| Immigrants | Immigrants | 43.2 /100 | #182 | Average 4.4% |
| Bermudans | 43.1 /100 | #183 | Average 4.4% |
| Belgians | 36.2 /100 | #184 | Fair 4.3% |