Immigrants from Sri Lanka vs Scotch-Irish 11th Grade
COMPARE
Immigrants from Sri Lanka
Scotch-Irish
11th Grade
11th Grade Comparison
Immigrants from Sri Lanka
Scotch-Irish
93.2%
11TH GRADE
95.6/ 100
METRIC RATING
125th/ 347
METRIC RANK
93.9%
11TH GRADE
99.8/ 100
METRIC RATING
69th/ 347
METRIC RANK
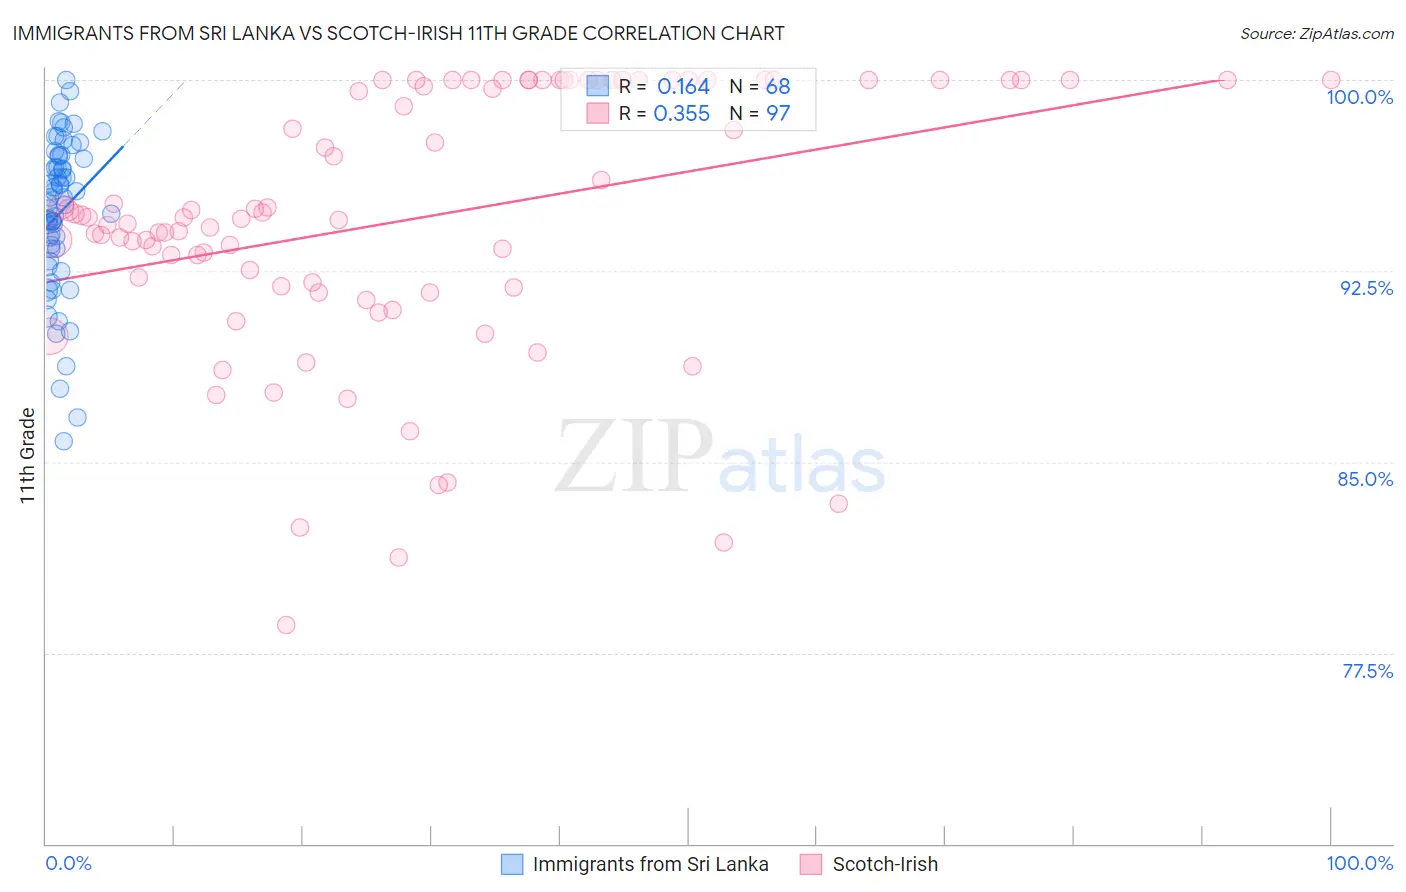
Immigrants from Sri Lanka vs Scotch-Irish 11th Grade Correlation Chart
The statistical analysis conducted on geographies consisting of 149,660,761 people shows a poor positive correlation between the proportion of Immigrants from Sri Lanka and percentage of population with at least 11th grade education in the United States with a correlation coefficient (R) of 0.164 and weighted average of 93.2%. Similarly, the statistical analysis conducted on geographies consisting of 548,779,872 people shows a mild positive correlation between the proportion of Scotch-Irish and percentage of population with at least 11th grade education in the United States with a correlation coefficient (R) of 0.355 and weighted average of 93.9%, a difference of 0.72%.
11th Grade Correlation Summary
| Measurement | Immigrants from Sri Lanka | Scotch-Irish |
| Minimum | 85.8% | 78.6% |
| Maximum | 100.0% | 100.0% |
| Range | 14.2% | 21.4% |
| Mean | 94.8% | 94.5% |
| Median | 95.3% | 94.6% |
| Interquartile 25% (IQ1) | 93.4% | 91.9% |
| Interquartile 75% (IQ3) | 97.0% | 100.0% |
| Interquartile Range (IQR) | 3.6% | 8.1% |
| Standard Deviation (Sample) | 3.0% | 5.2% |
| Standard Deviation (Population) | 3.0% | 5.1% |
Similar Demographics by 11th Grade
Demographics Similar to Immigrants from Sri Lanka by 11th Grade
In terms of 11th grade, the demographic groups most similar to Immigrants from Sri Lanka are Immigrants from Greece (93.2%, a difference of 0.020%), Immigrants from Eastern Europe (93.2%, a difference of 0.020%), Basque (93.2%, a difference of 0.020%), Immigrants from Belarus (93.3%, a difference of 0.040%), and German Russian (93.3%, a difference of 0.050%).
| Demographics | Rating | Rank | 11th Grade |
| Immigrants | Korea | 97.0 /100 | #118 | Exceptional 93.3% |
| Israelis | 97.0 /100 | #119 | Exceptional 93.3% |
| Immigrants | Russia | 96.6 /100 | #120 | Exceptional 93.3% |
| German Russians | 96.4 /100 | #121 | Exceptional 93.3% |
| Immigrants | Belarus | 96.3 /100 | #122 | Exceptional 93.3% |
| Immigrants | Greece | 95.9 /100 | #123 | Exceptional 93.2% |
| Immigrants | Eastern Europe | 95.9 /100 | #124 | Exceptional 93.2% |
| Immigrants | Sri Lanka | 95.6 /100 | #125 | Exceptional 93.2% |
| Basques | 95.2 /100 | #126 | Exceptional 93.2% |
| Immigrants | Kazakhstan | 92.4 /100 | #127 | Exceptional 93.1% |
| Immigrants | Jordan | 92.4 /100 | #128 | Exceptional 93.1% |
| Immigrants | Ukraine | 89.8 /100 | #129 | Excellent 93.0% |
| Albanians | 89.5 /100 | #130 | Excellent 93.0% |
| Egyptians | 89.5 /100 | #131 | Excellent 93.0% |
| Immigrants | Bosnia and Herzegovina | 89.0 /100 | #132 | Excellent 93.0% |
Demographics Similar to Scotch-Irish by 11th Grade
In terms of 11th grade, the demographic groups most similar to Scotch-Irish are Zimbabwean (93.9%, a difference of 0.0%), Alaskan Athabascan (93.9%, a difference of 0.020%), Immigrants from Netherlands (93.9%, a difference of 0.020%), Immigrants from Sweden (93.9%, a difference of 0.040%), and Native Hawaiian (93.9%, a difference of 0.040%).
| Demographics | Rating | Rank | 11th Grade |
| Austrians | 99.8 /100 | #62 | Exceptional 94.0% |
| Ukrainians | 99.8 /100 | #63 | Exceptional 94.0% |
| Immigrants | Sweden | 99.8 /100 | #64 | Exceptional 93.9% |
| Native Hawaiians | 99.8 /100 | #65 | Exceptional 93.9% |
| Alaskan Athabascans | 99.8 /100 | #66 | Exceptional 93.9% |
| Immigrants | Netherlands | 99.8 /100 | #67 | Exceptional 93.9% |
| Zimbabweans | 99.8 /100 | #68 | Exceptional 93.9% |
| Scotch-Irish | 99.8 /100 | #69 | Exceptional 93.9% |
| Immigrants | England | 99.7 /100 | #70 | Exceptional 93.8% |
| Immigrants | South Africa | 99.7 /100 | #71 | Exceptional 93.8% |
| Immigrants | Japan | 99.7 /100 | #72 | Exceptional 93.8% |
| Romanians | 99.6 /100 | #73 | Exceptional 93.8% |
| Immigrants | Czechoslovakia | 99.6 /100 | #74 | Exceptional 93.8% |
| Immigrants | Latvia | 99.6 /100 | #75 | Exceptional 93.8% |
| Celtics | 99.5 /100 | #76 | Exceptional 93.7% |