Immigrants from South Eastern Asia vs Paraguayan 3rd Grade
COMPARE
Immigrants from South Eastern Asia
Paraguayan
3rd Grade
3rd Grade Comparison
Immigrants from South Eastern Asia
Paraguayans
96.8%
3RD GRADE
0.0/ 100
METRIC RATING
300th/ 347
METRIC RANK
97.7%
3RD GRADE
26.2/ 100
METRIC RATING
196th/ 347
METRIC RANK
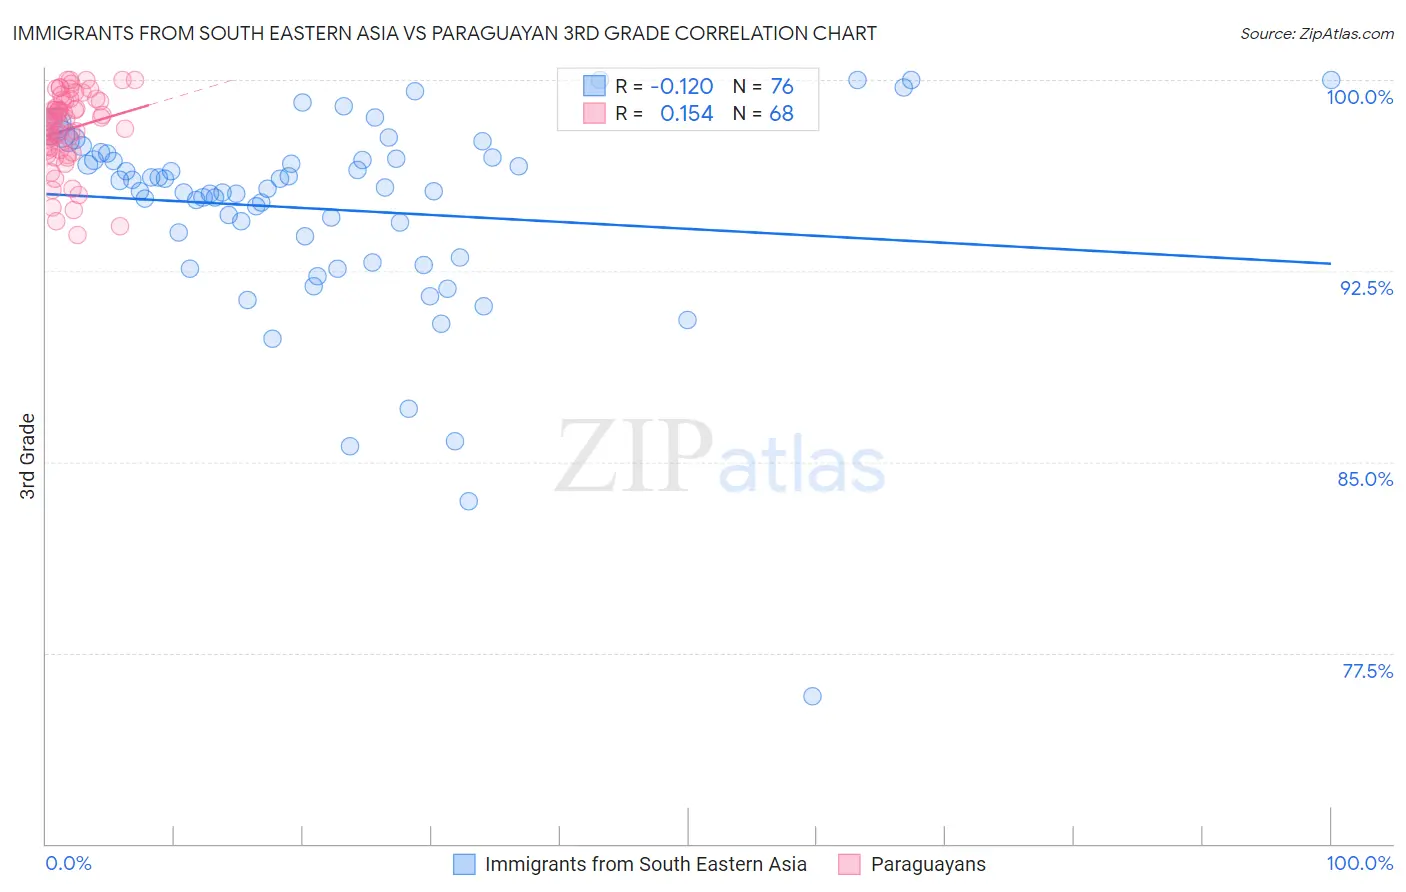
Immigrants from South Eastern Asia vs Paraguayan 3rd Grade Correlation Chart
The statistical analysis conducted on geographies consisting of 512,710,277 people shows a poor negative correlation between the proportion of Immigrants from South Eastern Asia and percentage of population with at least 3rd grade education in the United States with a correlation coefficient (R) of -0.120 and weighted average of 96.8%. Similarly, the statistical analysis conducted on geographies consisting of 95,115,093 people shows a poor positive correlation between the proportion of Paraguayans and percentage of population with at least 3rd grade education in the United States with a correlation coefficient (R) of 0.154 and weighted average of 97.7%, a difference of 0.87%.
3rd Grade Correlation Summary
| Measurement | Immigrants from South Eastern Asia | Paraguayan |
| Minimum | 75.8% | 93.9% |
| Maximum | 100.0% | 100.0% |
| Range | 24.2% | 6.1% |
| Mean | 94.9% | 98.1% |
| Median | 95.8% | 98.4% |
| Interquartile 25% (IQ1) | 93.5% | 97.3% |
| Interquartile 75% (IQ3) | 97.0% | 99.2% |
| Interquartile Range (IQR) | 3.6% | 1.9% |
| Standard Deviation (Sample) | 4.0% | 1.5% |
| Standard Deviation (Population) | 4.0% | 1.5% |
Similar Demographics by 3rd Grade
Demographics Similar to Immigrants from South Eastern Asia by 3rd Grade
In terms of 3rd grade, the demographic groups most similar to Immigrants from South Eastern Asia are Somali (96.8%, a difference of 0.010%), Immigrants from Cuba (96.8%, a difference of 0.010%), Haitian (96.9%, a difference of 0.020%), Immigrants from Dominica (96.9%, a difference of 0.020%), and Immigrants (96.9%, a difference of 0.050%).
| Demographics | Rating | Rank | 3rd Grade |
| Immigrants | Grenada | 0.0 /100 | #293 | Tragic 97.0% |
| Malaysians | 0.0 /100 | #294 | Tragic 97.0% |
| Immigrants | Eritrea | 0.0 /100 | #295 | Tragic 97.0% |
| Immigrants | Immigrants | 0.0 /100 | #296 | Tragic 96.9% |
| Haitians | 0.0 /100 | #297 | Tragic 96.9% |
| Immigrants | Dominica | 0.0 /100 | #298 | Tragic 96.9% |
| Somalis | 0.0 /100 | #299 | Tragic 96.8% |
| Immigrants | South Eastern Asia | 0.0 /100 | #300 | Tragic 96.8% |
| Immigrants | Cuba | 0.0 /100 | #301 | Tragic 96.8% |
| Immigrants | Somalia | 0.0 /100 | #302 | Tragic 96.8% |
| Ecuadorians | 0.0 /100 | #303 | Tragic 96.7% |
| Immigrants | Caribbean | 0.0 /100 | #304 | Tragic 96.7% |
| Central American Indians | 0.0 /100 | #305 | Tragic 96.7% |
| Guyanese | 0.0 /100 | #306 | Tragic 96.7% |
| Nicaraguans | 0.0 /100 | #307 | Tragic 96.7% |
Demographics Similar to Paraguayans by 3rd Grade
In terms of 3rd grade, the demographic groups most similar to Paraguayans are Immigrants from Egypt (97.7%, a difference of 0.0%), Hawaiian (97.7%, a difference of 0.0%), Black/African American (97.7%, a difference of 0.010%), Mongolian (97.7%, a difference of 0.010%), and Immigrants from Kenya (97.7%, a difference of 0.010%).
| Demographics | Rating | Rank | 3rd Grade |
| Pakistanis | 34.2 /100 | #189 | Fair 97.7% |
| Panamanians | 31.5 /100 | #190 | Fair 97.7% |
| Blacks/African Americans | 29.6 /100 | #191 | Fair 97.7% |
| Mongolians | 29.1 /100 | #192 | Fair 97.7% |
| Immigrants | Kenya | 28.2 /100 | #193 | Fair 97.7% |
| Immigrants | Uganda | 27.4 /100 | #194 | Fair 97.7% |
| Immigrants | Egypt | 26.8 /100 | #195 | Fair 97.7% |
| Paraguayans | 26.2 /100 | #196 | Fair 97.7% |
| Hawaiians | 25.7 /100 | #197 | Fair 97.7% |
| Guamanians/Chamorros | 23.6 /100 | #198 | Fair 97.7% |
| Immigrants | Ukraine | 22.7 /100 | #199 | Fair 97.7% |
| Immigrants | Albania | 22.6 /100 | #200 | Fair 97.7% |
| Immigrants | Lebanon | 21.7 /100 | #201 | Fair 97.7% |
| Immigrants | Southern Europe | 17.7 /100 | #202 | Poor 97.6% |
| Paiute | 16.7 /100 | #203 | Poor 97.6% |