Immigrants from South Eastern Asia vs Guatemalan 4th Grade
COMPARE
Immigrants from South Eastern Asia
Guatemalan
4th Grade
4th Grade Comparison
Immigrants from South Eastern Asia
Guatemalans
96.5%
4TH GRADE
0.0/ 100
METRIC RATING
300th/ 347
METRIC RANK
95.3%
4TH GRADE
0.0/ 100
METRIC RATING
339th/ 347
METRIC RANK
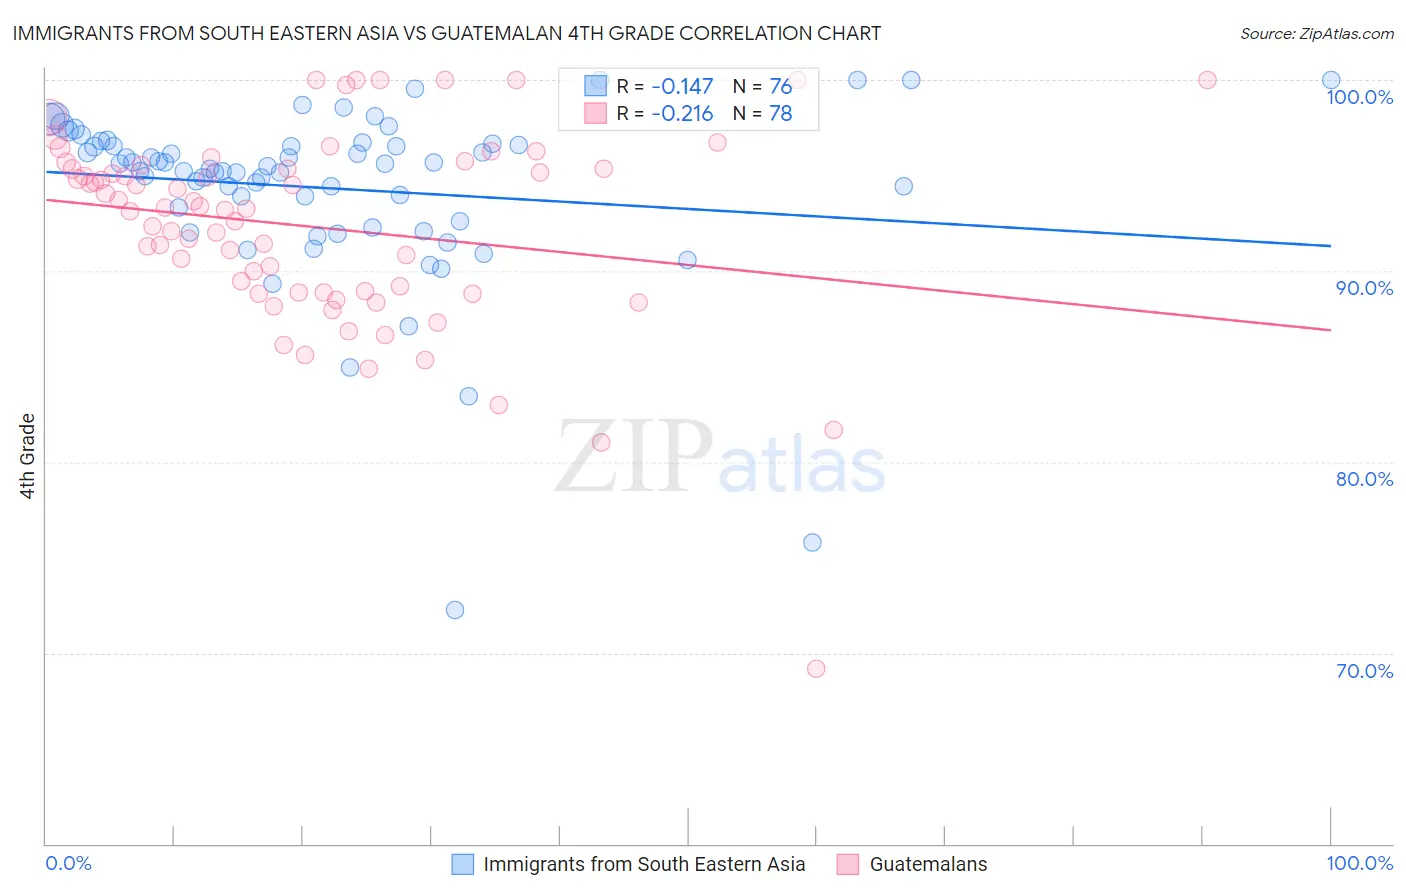
Immigrants from South Eastern Asia vs Guatemalan 4th Grade Correlation Chart
The statistical analysis conducted on geographies consisting of 512,710,223 people shows a poor negative correlation between the proportion of Immigrants from South Eastern Asia and percentage of population with at least 4th grade education in the United States with a correlation coefficient (R) of -0.147 and weighted average of 96.5%. Similarly, the statistical analysis conducted on geographies consisting of 409,566,469 people shows a weak negative correlation between the proportion of Guatemalans and percentage of population with at least 4th grade education in the United States with a correlation coefficient (R) of -0.216 and weighted average of 95.3%, a difference of 1.3%.
4th Grade Correlation Summary
| Measurement | Immigrants from South Eastern Asia | Guatemalan |
| Minimum | 72.2% | 69.2% |
| Maximum | 100.0% | 100.0% |
| Range | 27.8% | 30.8% |
| Mean | 94.3% | 92.3% |
| Median | 95.4% | 93.3% |
| Interquartile 25% (IQ1) | 93.0% | 88.8% |
| Interquartile 75% (IQ3) | 96.6% | 95.4% |
| Interquartile Range (IQR) | 3.7% | 6.5% |
| Standard Deviation (Sample) | 4.6% | 5.2% |
| Standard Deviation (Population) | 4.6% | 5.2% |
Similar Demographics by 4th Grade
Demographics Similar to Immigrants from South Eastern Asia by 4th Grade
In terms of 4th grade, the demographic groups most similar to Immigrants from South Eastern Asia are Haitian (96.5%, a difference of 0.010%), Immigrants from Dominica (96.5%, a difference of 0.010%), Immigrants from Somalia (96.5%, a difference of 0.040%), Immigrants (96.5%, a difference of 0.050%), and Immigrants from Cuba (96.4%, a difference of 0.080%).
| Demographics | Rating | Rank | 4th Grade |
| Puerto Ricans | 0.0 /100 | #293 | Tragic 96.7% |
| Immigrants | Eritrea | 0.0 /100 | #294 | Tragic 96.7% |
| Immigrants | Portugal | 0.0 /100 | #295 | Tragic 96.6% |
| Somalis | 0.0 /100 | #296 | Tragic 96.6% |
| Immigrants | Somalia | 0.0 /100 | #297 | Tragic 96.5% |
| Haitians | 0.0 /100 | #298 | Tragic 96.5% |
| Immigrants | Dominica | 0.0 /100 | #299 | Tragic 96.5% |
| Immigrants | South Eastern Asia | 0.0 /100 | #300 | Tragic 96.5% |
| Immigrants | Immigrants | 0.0 /100 | #301 | Tragic 96.5% |
| Immigrants | Cuba | 0.0 /100 | #302 | Tragic 96.4% |
| Guyanese | 0.0 /100 | #303 | Tragic 96.4% |
| Ecuadorians | 0.0 /100 | #304 | Tragic 96.4% |
| Immigrants | Caribbean | 0.0 /100 | #305 | Tragic 96.4% |
| Sri Lankans | 0.0 /100 | #306 | Tragic 96.4% |
| Immigrants | Haiti | 0.0 /100 | #307 | Tragic 96.3% |
Demographics Similar to Guatemalans by 4th Grade
In terms of 4th grade, the demographic groups most similar to Guatemalans are Yakama (95.2%, a difference of 0.090%), Immigrants from Yemen (95.2%, a difference of 0.11%), Immigrants from Central America (95.1%, a difference of 0.19%), Central American (95.5%, a difference of 0.20%), and Nepalese (95.5%, a difference of 0.20%).
| Demographics | Rating | Rank | 4th Grade |
| Immigrants | Honduras | 0.0 /100 | #332 | Tragic 95.8% |
| Immigrants | Dominican Republic | 0.0 /100 | #333 | Tragic 95.7% |
| Immigrants | Cabo Verde | 0.0 /100 | #334 | Tragic 95.7% |
| Immigrants | Latin America | 0.0 /100 | #335 | Tragic 95.7% |
| Mexicans | 0.0 /100 | #336 | Tragic 95.6% |
| Central Americans | 0.0 /100 | #337 | Tragic 95.5% |
| Nepalese | 0.0 /100 | #338 | Tragic 95.5% |
| Guatemalans | 0.0 /100 | #339 | Tragic 95.3% |
| Yakama | 0.0 /100 | #340 | Tragic 95.2% |
| Immigrants | Yemen | 0.0 /100 | #341 | Tragic 95.2% |
| Immigrants | Central America | 0.0 /100 | #342 | Tragic 95.1% |
| Immigrants | Guatemala | 0.0 /100 | #343 | Tragic 95.1% |
| Immigrants | Mexico | 0.0 /100 | #344 | Tragic 95.1% |
| Salvadorans | 0.0 /100 | #345 | Tragic 95.0% |
| Immigrants | El Salvador | 0.0 /100 | #346 | Tragic 94.8% |