Immigrants from South Eastern Asia vs Bulgarian 12th Grade, No Diploma
COMPARE
Immigrants from South Eastern Asia
Bulgarian
12th Grade, No Diploma
12th Grade, No Diploma Comparison
Immigrants from South Eastern Asia
Bulgarians
89.6%
12TH GRADE, NO DIPLOMA
0.4/ 100
METRIC RATING
260th/ 347
METRIC RANK
93.5%
12TH GRADE, NO DIPLOMA
100.0/ 100
METRIC RATING
14th/ 347
METRIC RANK
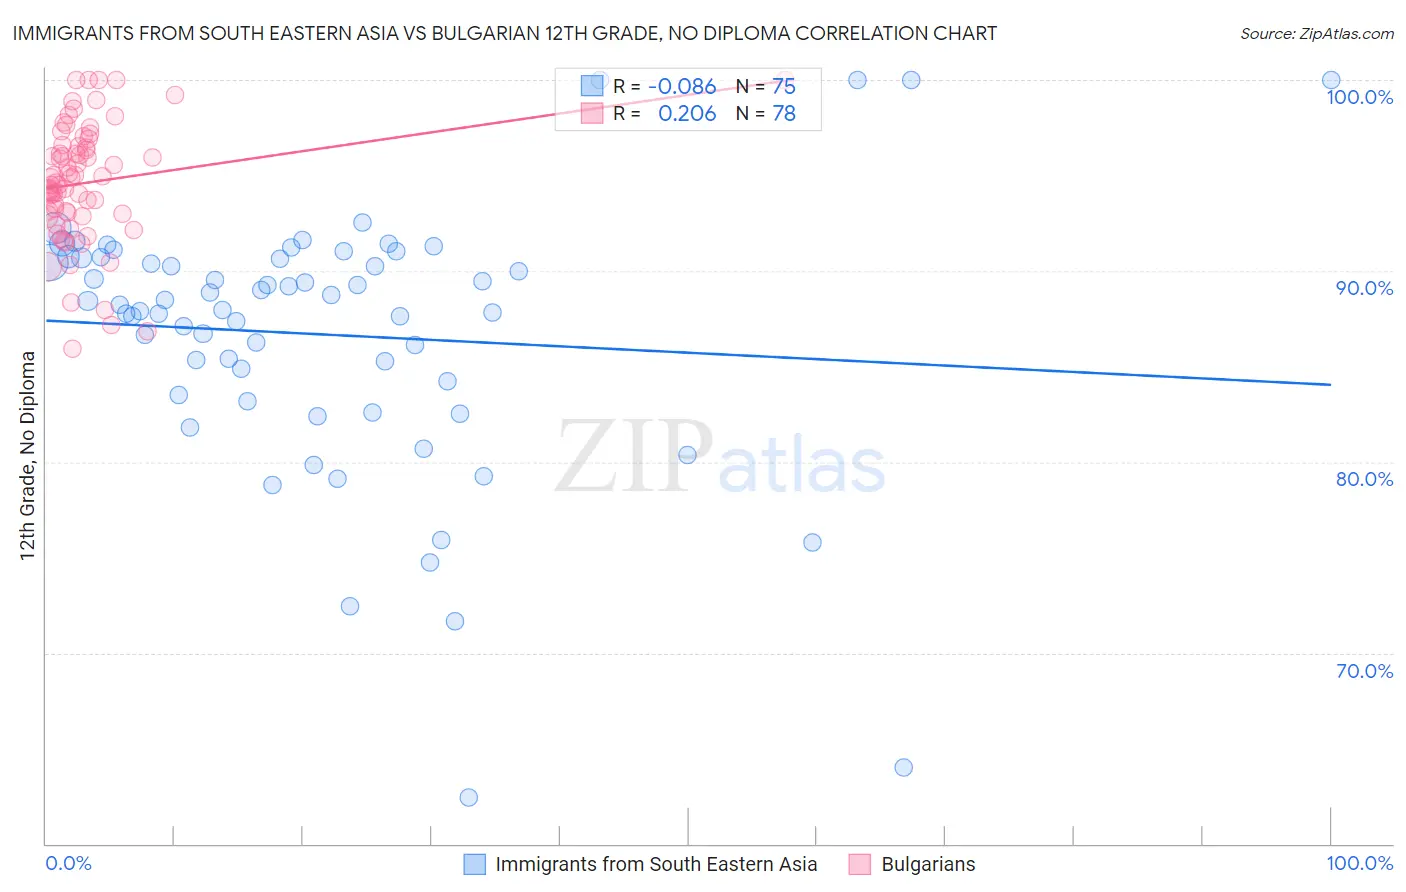
Immigrants from South Eastern Asia vs Bulgarian 12th Grade, No Diploma Correlation Chart
The statistical analysis conducted on geographies consisting of 512,709,822 people shows a slight negative correlation between the proportion of Immigrants from South Eastern Asia and percentage of population with at least 12th grade (no diploma) education in the United States with a correlation coefficient (R) of -0.086 and weighted average of 89.6%. Similarly, the statistical analysis conducted on geographies consisting of 205,633,404 people shows a weak positive correlation between the proportion of Bulgarians and percentage of population with at least 12th grade (no diploma) education in the United States with a correlation coefficient (R) of 0.206 and weighted average of 93.5%, a difference of 4.3%.
12th Grade, No Diploma Correlation Summary
| Measurement | Immigrants from South Eastern Asia | Bulgarian |
| Minimum | 62.4% | 85.9% |
| Maximum | 100.0% | 100.0% |
| Range | 37.6% | 14.1% |
| Mean | 86.7% | 94.6% |
| Median | 88.2% | 94.7% |
| Interquartile 25% (IQ1) | 83.5% | 93.0% |
| Interquartile 75% (IQ3) | 90.7% | 96.5% |
| Interquartile Range (IQR) | 7.2% | 3.5% |
| Standard Deviation (Sample) | 6.9% | 3.1% |
| Standard Deviation (Population) | 6.9% | 3.1% |
Similar Demographics by 12th Grade, No Diploma
Demographics Similar to Immigrants from South Eastern Asia by 12th Grade, No Diploma
In terms of 12th grade, no diploma, the demographic groups most similar to Immigrants from South Eastern Asia are Immigrants from Western Africa (89.6%, a difference of 0.010%), Cheyenne (89.6%, a difference of 0.010%), Sioux (89.6%, a difference of 0.010%), African (89.6%, a difference of 0.040%), and Jamaican (89.7%, a difference of 0.080%).
| Demographics | Rating | Rank | 12th Grade, No Diploma |
| Choctaw | 0.7 /100 | #253 | Tragic 89.8% |
| Immigrants | Peru | 0.5 /100 | #254 | Tragic 89.7% |
| Immigrants | Senegal | 0.5 /100 | #255 | Tragic 89.7% |
| Immigrants | Ghana | 0.5 /100 | #256 | Tragic 89.7% |
| Jamaicans | 0.5 /100 | #257 | Tragic 89.7% |
| Africans | 0.4 /100 | #258 | Tragic 89.6% |
| Immigrants | Western Africa | 0.4 /100 | #259 | Tragic 89.6% |
| Immigrants | South Eastern Asia | 0.4 /100 | #260 | Tragic 89.6% |
| Cheyenne | 0.4 /100 | #261 | Tragic 89.6% |
| Sioux | 0.4 /100 | #262 | Tragic 89.6% |
| Immigrants | Jamaica | 0.2 /100 | #263 | Tragic 89.5% |
| Sri Lankans | 0.2 /100 | #264 | Tragic 89.4% |
| Trinidadians and Tobagonians | 0.2 /100 | #265 | Tragic 89.4% |
| Seminole | 0.2 /100 | #266 | Tragic 89.4% |
| West Indians | 0.2 /100 | #267 | Tragic 89.3% |
Demographics Similar to Bulgarians by 12th Grade, No Diploma
In terms of 12th grade, no diploma, the demographic groups most similar to Bulgarians are Danish (93.5%, a difference of 0.020%), Eastern European (93.5%, a difference of 0.040%), Polish (93.5%, a difference of 0.050%), Finnish (93.4%, a difference of 0.090%), and Croatian (93.5%, a difference of 0.10%).
| Demographics | Rating | Rank | 12th Grade, No Diploma |
| Slovaks | 100.0 /100 | #7 | Exceptional 93.6% |
| Chinese | 100.0 /100 | #8 | Exceptional 93.6% |
| Latvians | 100.0 /100 | #9 | Exceptional 93.6% |
| Croatians | 100.0 /100 | #10 | Exceptional 93.5% |
| Poles | 100.0 /100 | #11 | Exceptional 93.5% |
| Eastern Europeans | 100.0 /100 | #12 | Exceptional 93.5% |
| Danes | 100.0 /100 | #13 | Exceptional 93.5% |
| Bulgarians | 100.0 /100 | #14 | Exceptional 93.5% |
| Finns | 100.0 /100 | #15 | Exceptional 93.4% |
| Maltese | 100.0 /100 | #16 | Exceptional 93.3% |
| Luxembourgers | 100.0 /100 | #17 | Exceptional 93.3% |
| Immigrants | Singapore | 99.9 /100 | #18 | Exceptional 93.3% |
| Germans | 99.9 /100 | #19 | Exceptional 93.3% |
| Filipinos | 99.9 /100 | #20 | Exceptional 93.2% |
| Italians | 99.9 /100 | #21 | Exceptional 93.2% |