Immigrants from South Central Asia vs Yaqui 7th Grade
COMPARE
Immigrants from South Central Asia
Yaqui
7th Grade
7th Grade Comparison
Immigrants from South Central Asia
Yaqui
96.3%
7TH GRADE
87.1/ 100
METRIC RATING
141st/ 347
METRIC RANK
94.6%
7TH GRADE
0.0/ 100
METRIC RATING
295th/ 347
METRIC RANK
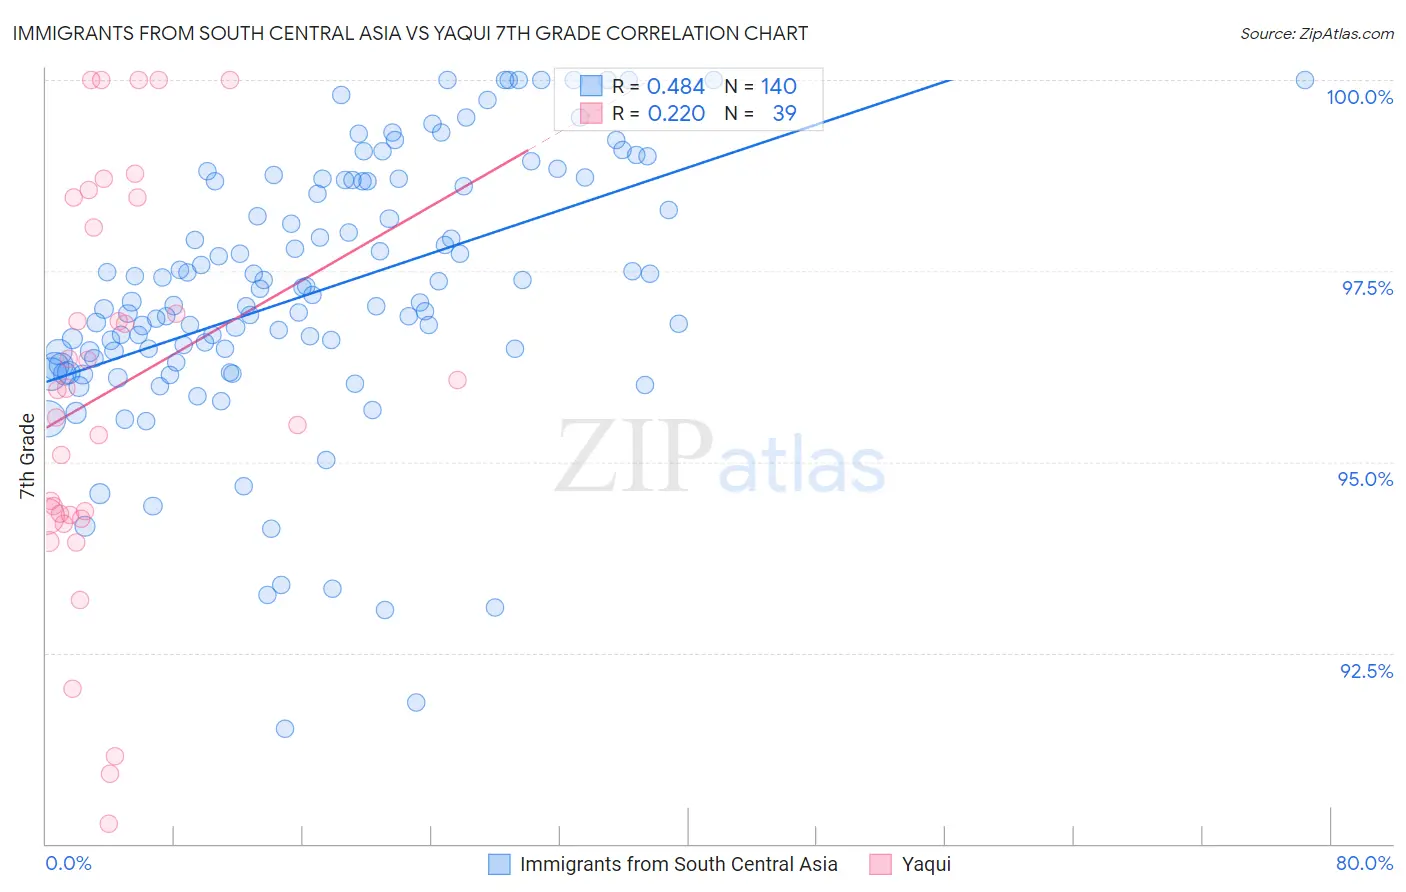
Immigrants from South Central Asia vs Yaqui 7th Grade Correlation Chart
The statistical analysis conducted on geographies consisting of 473,113,181 people shows a moderate positive correlation between the proportion of Immigrants from South Central Asia and percentage of population with at least 7th grade education in the United States with a correlation coefficient (R) of 0.484 and weighted average of 96.3%. Similarly, the statistical analysis conducted on geographies consisting of 107,725,021 people shows a weak positive correlation between the proportion of Yaqui and percentage of population with at least 7th grade education in the United States with a correlation coefficient (R) of 0.220 and weighted average of 94.6%, a difference of 1.8%.
7th Grade Correlation Summary
| Measurement | Immigrants from South Central Asia | Yaqui |
| Minimum | 91.5% | 90.3% |
| Maximum | 100.0% | 100.0% |
| Range | 8.5% | 9.7% |
| Mean | 97.2% | 95.9% |
| Median | 97.1% | 95.9% |
| Interquartile 25% (IQ1) | 96.3% | 94.3% |
| Interquartile 75% (IQ3) | 98.7% | 98.5% |
| Interquartile Range (IQR) | 2.3% | 4.2% |
| Standard Deviation (Sample) | 1.7% | 2.6% |
| Standard Deviation (Population) | 1.7% | 2.6% |
Similar Demographics by 7th Grade
Demographics Similar to Immigrants from South Central Asia by 7th Grade
In terms of 7th grade, the demographic groups most similar to Immigrants from South Central Asia are Burmese (96.3%, a difference of 0.0%), Spanish (96.3%, a difference of 0.010%), Cambodian (96.3%, a difference of 0.020%), Immigrants from Greece (96.3%, a difference of 0.020%), and Basque (96.4%, a difference of 0.030%).
| Demographics | Rating | Rank | 7th Grade |
| Soviet Union | 91.2 /100 | #134 | Exceptional 96.4% |
| Immigrants | Kuwait | 91.1 /100 | #135 | Exceptional 96.4% |
| Immigrants | Hungary | 90.6 /100 | #136 | Exceptional 96.4% |
| Immigrants | Turkey | 90.2 /100 | #137 | Exceptional 96.4% |
| Jordanians | 90.0 /100 | #138 | Excellent 96.4% |
| Basques | 89.3 /100 | #139 | Excellent 96.4% |
| Cambodians | 88.3 /100 | #140 | Excellent 96.3% |
| Immigrants | South Central Asia | 87.1 /100 | #141 | Excellent 96.3% |
| Burmese | 87.1 /100 | #142 | Excellent 96.3% |
| Spanish | 86.6 /100 | #143 | Excellent 96.3% |
| Immigrants | Greece | 85.9 /100 | #144 | Excellent 96.3% |
| Blackfeet | 83.9 /100 | #145 | Excellent 96.3% |
| Immigrants | Eastern Europe | 83.7 /100 | #146 | Excellent 96.3% |
| French American Indians | 83.1 /100 | #147 | Excellent 96.3% |
| Israelis | 82.8 /100 | #148 | Excellent 96.3% |
Demographics Similar to Yaqui by 7th Grade
In terms of 7th grade, the demographic groups most similar to Yaqui are Cuban (94.6%, a difference of 0.010%), Haitian (94.7%, a difference of 0.030%), Fijian (94.7%, a difference of 0.11%), Immigrants from South Eastern Asia (94.5%, a difference of 0.11%), and Indonesian (94.5%, a difference of 0.11%).
| Demographics | Rating | Rank | 7th Grade |
| British West Indians | 0.0 /100 | #288 | Tragic 94.8% |
| Taiwanese | 0.0 /100 | #289 | Tragic 94.8% |
| Malaysians | 0.0 /100 | #290 | Tragic 94.8% |
| Immigrants | Grenada | 0.0 /100 | #291 | Tragic 94.8% |
| Immigrants | West Indies | 0.0 /100 | #292 | Tragic 94.8% |
| Fijians | 0.0 /100 | #293 | Tragic 94.7% |
| Haitians | 0.0 /100 | #294 | Tragic 94.7% |
| Yaqui | 0.0 /100 | #295 | Tragic 94.6% |
| Cubans | 0.0 /100 | #296 | Tragic 94.6% |
| Immigrants | South Eastern Asia | 0.0 /100 | #297 | Tragic 94.5% |
| Indonesians | 0.0 /100 | #298 | Tragic 94.5% |
| Bangladeshis | 0.0 /100 | #299 | Tragic 94.5% |
| Immigrants | Burma/Myanmar | 0.0 /100 | #300 | Tragic 94.5% |
| Immigrants | Dominica | 0.0 /100 | #301 | Tragic 94.5% |
| Immigrants | Laos | 0.0 /100 | #302 | Tragic 94.5% |