Immigrants from South Africa vs Immigrants from St. Vincent and the Grenadines Associate's Degree
COMPARE
Immigrants from South Africa
Immigrants from St. Vincent and the Grenadines
Associate's Degree
Associate's Degree Comparison
Immigrants from South Africa
Immigrants from St. Vincent and the Grenadines
52.5%
ASSOCIATE'S DEGREE
99.9/ 100
METRIC RATING
43rd/ 347
METRIC RANK
42.9%
ASSOCIATE'S DEGREE
1.9/ 100
METRIC RATING
236th/ 347
METRIC RANK
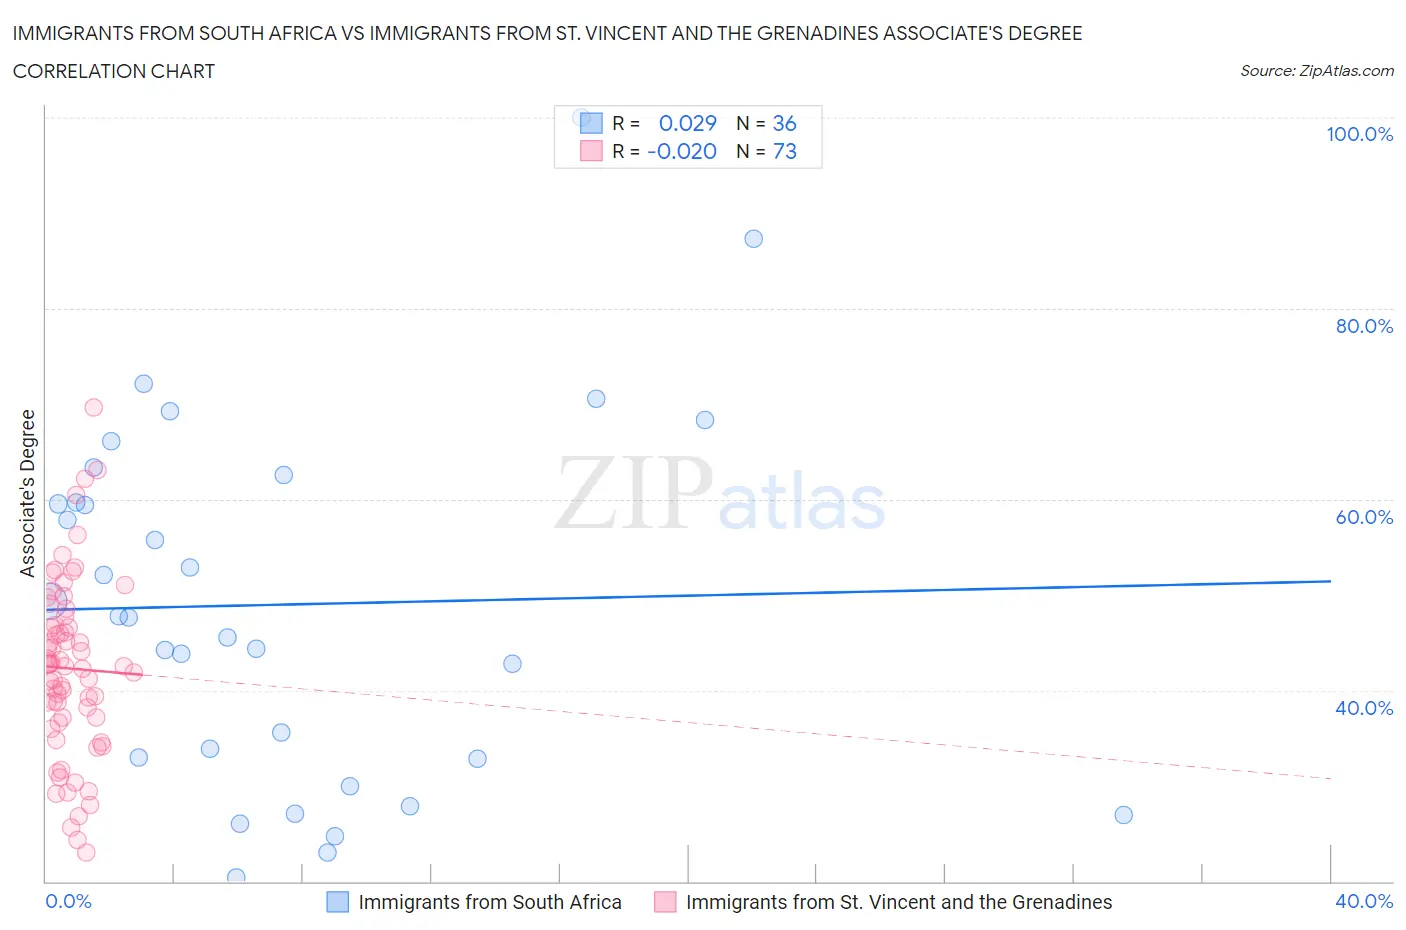
Immigrants from South Africa vs Immigrants from St. Vincent and the Grenadines Associate's Degree Correlation Chart
The statistical analysis conducted on geographies consisting of 233,315,008 people shows no correlation between the proportion of Immigrants from South Africa and percentage of population with at least associate's degree education in the United States with a correlation coefficient (R) of 0.029 and weighted average of 52.5%. Similarly, the statistical analysis conducted on geographies consisting of 56,191,418 people shows no correlation between the proportion of Immigrants from St. Vincent and the Grenadines and percentage of population with at least associate's degree education in the United States with a correlation coefficient (R) of -0.020 and weighted average of 42.9%, a difference of 22.4%.
Associate's Degree Correlation Summary
| Measurement | Immigrants from South Africa | Immigrants from St. Vincent and the Grenadines |
| Minimum | 20.4% | 23.0% |
| Maximum | 100.0% | 69.7% |
| Range | 79.6% | 46.7% |
| Mean | 49.0% | 42.3% |
| Median | 47.7% | 42.6% |
| Interquartile 25% (IQ1) | 32.9% | 36.9% |
| Interquartile 75% (IQ3) | 61.1% | 47.3% |
| Interquartile Range (IQR) | 28.1% | 10.4% |
| Standard Deviation (Sample) | 18.9% | 9.2% |
| Standard Deviation (Population) | 18.6% | 9.2% |
Similar Demographics by Associate's Degree
Demographics Similar to Immigrants from South Africa by Associate's Degree
In terms of associate's degree, the demographic groups most similar to Immigrants from South Africa are Immigrants from Malaysia (52.5%, a difference of 0.010%), Immigrants from Saudi Arabia (52.6%, a difference of 0.040%), Estonian (52.5%, a difference of 0.090%), Immigrants from Lithuania (52.4%, a difference of 0.16%), and Immigrants from Bulgaria (52.4%, a difference of 0.30%).
| Demographics | Rating | Rank | Associate's Degree |
| Immigrants | Russia | 100.0 /100 | #36 | Exceptional 53.1% |
| Immigrants | Denmark | 100.0 /100 | #37 | Exceptional 53.1% |
| Mongolians | 100.0 /100 | #38 | Exceptional 53.0% |
| Immigrants | Belarus | 99.9 /100 | #39 | Exceptional 52.8% |
| Immigrants | Latvia | 99.9 /100 | #40 | Exceptional 52.8% |
| Immigrants | Saudi Arabia | 99.9 /100 | #41 | Exceptional 52.6% |
| Immigrants | Malaysia | 99.9 /100 | #42 | Exceptional 52.5% |
| Immigrants | South Africa | 99.9 /100 | #43 | Exceptional 52.5% |
| Estonians | 99.9 /100 | #44 | Exceptional 52.5% |
| Immigrants | Lithuania | 99.9 /100 | #45 | Exceptional 52.4% |
| Immigrants | Bulgaria | 99.9 /100 | #46 | Exceptional 52.4% |
| Immigrants | Kuwait | 99.9 /100 | #47 | Exceptional 52.4% |
| Immigrants | Norway | 99.9 /100 | #48 | Exceptional 52.2% |
| Immigrants | Austria | 99.9 /100 | #49 | Exceptional 52.1% |
| Asians | 99.9 /100 | #50 | Exceptional 52.1% |
Demographics Similar to Immigrants from St. Vincent and the Grenadines by Associate's Degree
In terms of associate's degree, the demographic groups most similar to Immigrants from St. Vincent and the Grenadines are Nonimmigrants (42.9%, a difference of 0.020%), Ecuadorian (43.0%, a difference of 0.080%), Tlingit-Haida (43.0%, a difference of 0.18%), Tongan (43.0%, a difference of 0.27%), and Iroquois (42.8%, a difference of 0.28%).
| Demographics | Rating | Rank | Associate's Degree |
| Immigrants | Trinidad and Tobago | 3.0 /100 | #229 | Tragic 43.3% |
| Immigrants | Barbados | 2.9 /100 | #230 | Tragic 43.3% |
| Liberians | 2.9 /100 | #231 | Tragic 43.3% |
| Native Hawaiians | 2.3 /100 | #232 | Tragic 43.1% |
| Tongans | 2.2 /100 | #233 | Tragic 43.0% |
| Tlingit-Haida | 2.1 /100 | #234 | Tragic 43.0% |
| Ecuadorians | 2.0 /100 | #235 | Tragic 43.0% |
| Immigrants | St. Vincent and the Grenadines | 1.9 /100 | #236 | Tragic 42.9% |
| Immigrants | Nonimmigrants | 1.9 /100 | #237 | Tragic 42.9% |
| Iroquois | 1.7 /100 | #238 | Tragic 42.8% |
| Immigrants | Grenada | 1.3 /100 | #239 | Tragic 42.6% |
| Cree | 1.2 /100 | #240 | Tragic 42.5% |
| British West Indians | 1.0 /100 | #241 | Tragic 42.4% |
| Immigrants | West Indies | 1.0 /100 | #242 | Tragic 42.4% |
| Guyanese | 1.0 /100 | #243 | Tragic 42.3% |