Immigrants from Somalia vs Immigrants from Hong Kong 1st Grade
COMPARE
Immigrants from Somalia
Immigrants from Hong Kong
1st Grade
1st Grade Comparison
Immigrants from Somalia
Immigrants from Hong Kong
96.9%
1ST GRADE
0.0/ 100
METRIC RATING
307th/ 347
METRIC RANK
97.3%
1ST GRADE
0.0/ 100
METRIC RATING
287th/ 347
METRIC RANK
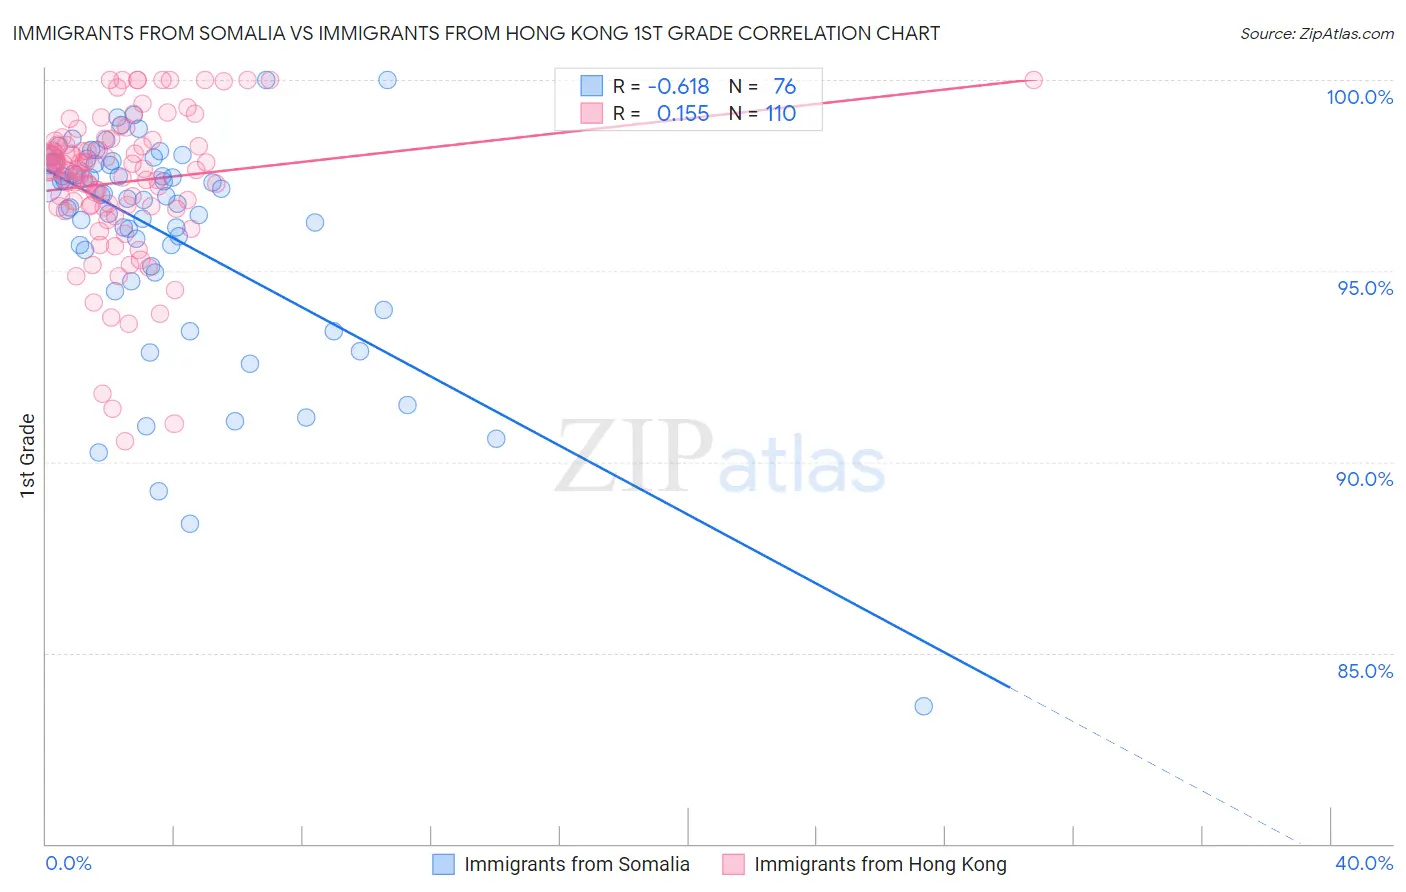
Immigrants from Somalia vs Immigrants from Hong Kong 1st Grade Correlation Chart
The statistical analysis conducted on geographies consisting of 92,111,755 people shows a significant negative correlation between the proportion of Immigrants from Somalia and percentage of population with at least 1st grade education in the United States with a correlation coefficient (R) of -0.618 and weighted average of 96.9%. Similarly, the statistical analysis conducted on geographies consisting of 253,948,669 people shows a poor positive correlation between the proportion of Immigrants from Hong Kong and percentage of population with at least 1st grade education in the United States with a correlation coefficient (R) of 0.155 and weighted average of 97.3%, a difference of 0.35%.
1st Grade Correlation Summary
| Measurement | Immigrants from Somalia | Immigrants from Hong Kong |
| Minimum | 83.6% | 90.5% |
| Maximum | 100.0% | 100.0% |
| Range | 16.4% | 9.5% |
| Mean | 96.0% | 97.3% |
| Median | 97.0% | 97.7% |
| Interquartile 25% (IQ1) | 95.3% | 96.7% |
| Interquartile 75% (IQ3) | 97.8% | 98.3% |
| Interquartile Range (IQR) | 2.5% | 1.6% |
| Standard Deviation (Sample) | 2.9% | 1.9% |
| Standard Deviation (Population) | 2.9% | 1.9% |
Demographics Similar to Immigrants from Somalia and Immigrants from Hong Kong by 1st Grade
In terms of 1st grade, the demographic groups most similar to Immigrants from Somalia are Belizean (96.9%, a difference of 0.010%), Nicaraguan (97.0%, a difference of 0.060%), Ecuadorian (97.0%, a difference of 0.060%), Somali (97.0%, a difference of 0.080%), and Immigrants from Caribbean (97.0%, a difference of 0.11%). Similarly, the demographic groups most similar to Immigrants from Hong Kong are Immigrants from Thailand (97.3%, a difference of 0.0%), Immigrants from Afghanistan (97.3%, a difference of 0.020%), Immigrants from St. Vincent and the Grenadines (97.3%, a difference of 0.030%), Houma (97.2%, a difference of 0.040%), and British West Indian (97.2%, a difference of 0.060%).
| Demographics | Rating | Rank | 1st Grade |
| Immigrants | Hong Kong | 0.0 /100 | #287 | Tragic 97.3% |
| Immigrants | Thailand | 0.0 /100 | #288 | Tragic 97.3% |
| Immigrants | Afghanistan | 0.0 /100 | #289 | Tragic 97.3% |
| Immigrants | St. Vincent and the Grenadines | 0.0 /100 | #290 | Tragic 97.3% |
| Houma | 0.0 /100 | #291 | Tragic 97.2% |
| British West Indians | 0.0 /100 | #292 | Tragic 97.2% |
| Malaysians | 0.0 /100 | #293 | Tragic 97.2% |
| Immigrants | Grenada | 0.0 /100 | #294 | Tragic 97.2% |
| Immigrants | Immigrants | 0.0 /100 | #295 | Tragic 97.2% |
| Immigrants | Eritrea | 0.0 /100 | #296 | Tragic 97.2% |
| Central American Indians | 0.0 /100 | #297 | Tragic 97.1% |
| Immigrants | Dominica | 0.0 /100 | #298 | Tragic 97.1% |
| Immigrants | Cuba | 0.0 /100 | #299 | Tragic 97.1% |
| Haitians | 0.0 /100 | #300 | Tragic 97.1% |
| Immigrants | South Eastern Asia | 0.0 /100 | #301 | Tragic 97.1% |
| Immigrants | Caribbean | 0.0 /100 | #302 | Tragic 97.0% |
| Somalis | 0.0 /100 | #303 | Tragic 97.0% |
| Nicaraguans | 0.0 /100 | #304 | Tragic 97.0% |
| Ecuadorians | 0.0 /100 | #305 | Tragic 97.0% |
| Belizeans | 0.0 /100 | #306 | Tragic 96.9% |
| Immigrants | Somalia | 0.0 /100 | #307 | Tragic 96.9% |