Immigrants from Somalia vs Colombian 2nd Grade
COMPARE
Immigrants from Somalia
Colombian
2nd Grade
2nd Grade Comparison
Immigrants from Somalia
Colombians
96.9%
2ND GRADE
0.0/ 100
METRIC RATING
306th/ 347
METRIC RANK
97.6%
2ND GRADE
1.9/ 100
METRIC RATING
235th/ 347
METRIC RANK
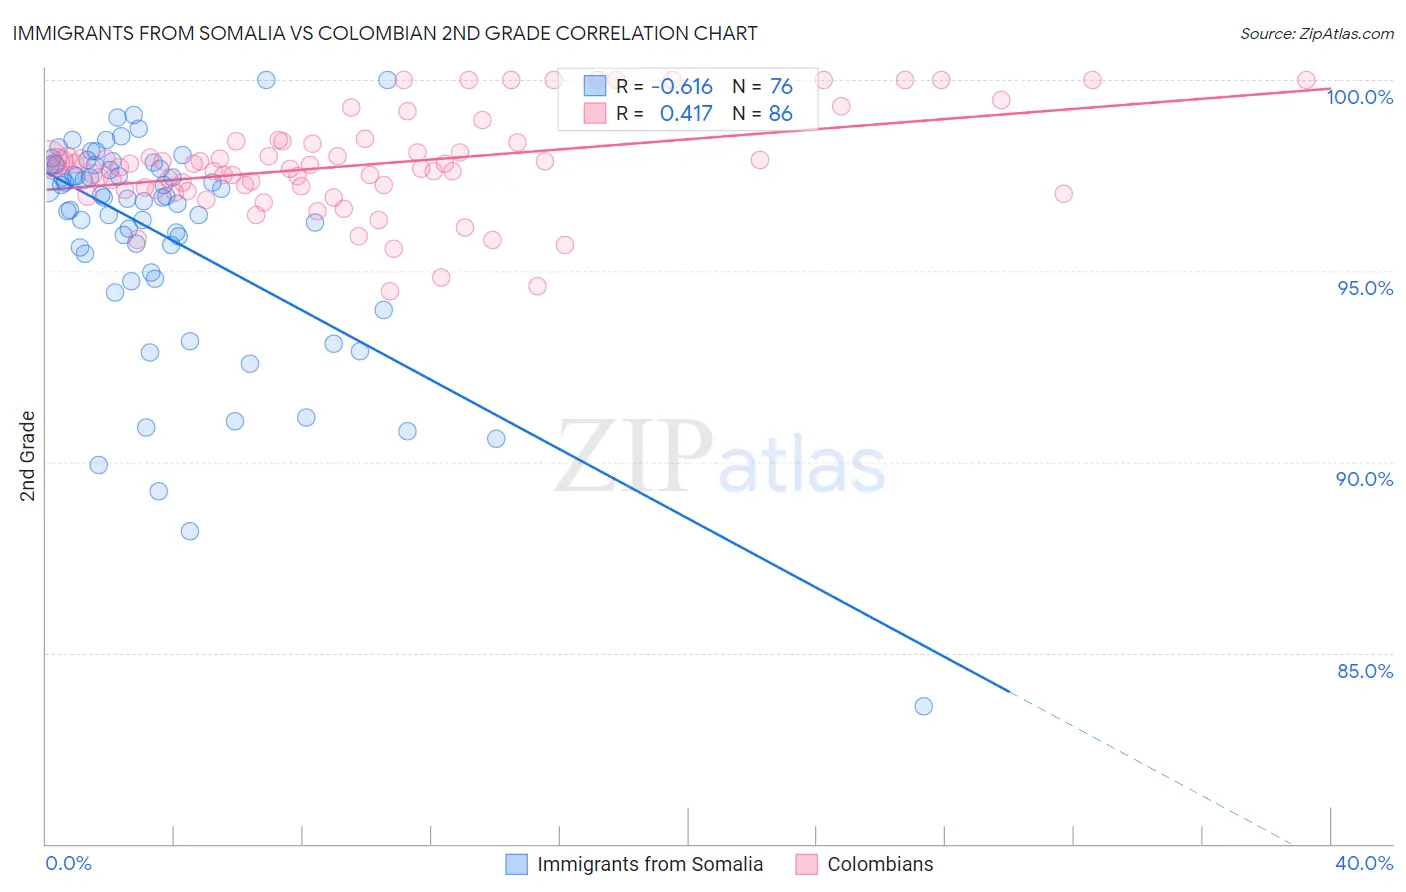
Immigrants from Somalia vs Colombian 2nd Grade Correlation Chart
The statistical analysis conducted on geographies consisting of 92,111,755 people shows a significant negative correlation between the proportion of Immigrants from Somalia and percentage of population with at least 2nd grade education in the United States with a correlation coefficient (R) of -0.616 and weighted average of 96.9%. Similarly, the statistical analysis conducted on geographies consisting of 419,700,680 people shows a moderate positive correlation between the proportion of Colombians and percentage of population with at least 2nd grade education in the United States with a correlation coefficient (R) of 0.417 and weighted average of 97.6%, a difference of 0.71%.
2nd Grade Correlation Summary
| Measurement | Immigrants from Somalia | Colombian |
| Minimum | 83.6% | 94.5% |
| Maximum | 100.0% | 100.0% |
| Range | 16.4% | 5.5% |
| Mean | 95.9% | 97.8% |
| Median | 96.9% | 97.8% |
| Interquartile 25% (IQ1) | 95.2% | 97.1% |
| Interquartile 75% (IQ3) | 97.8% | 98.4% |
| Interquartile Range (IQR) | 2.6% | 1.2% |
| Standard Deviation (Sample) | 2.9% | 1.3% |
| Standard Deviation (Population) | 2.9% | 1.3% |
Similar Demographics by 2nd Grade
Demographics Similar to Immigrants from Somalia by 2nd Grade
In terms of 2nd grade, the demographic groups most similar to Immigrants from Somalia are Nicaraguan (96.9%, a difference of 0.020%), Immigrants from the Azores (96.8%, a difference of 0.030%), Ecuadorian (96.9%, a difference of 0.040%), Immigrants from Caribbean (96.9%, a difference of 0.040%), and Immigrants from Haiti (96.8%, a difference of 0.040%).
| Demographics | Rating | Rank | 2nd Grade |
| Haitians | 0.0 /100 | #299 | Tragic 97.0% |
| Immigrants | South Eastern Asia | 0.0 /100 | #300 | Tragic 97.0% |
| Central American Indians | 0.0 /100 | #301 | Tragic 97.0% |
| Somalis | 0.0 /100 | #302 | Tragic 97.0% |
| Ecuadorians | 0.0 /100 | #303 | Tragic 96.9% |
| Immigrants | Caribbean | 0.0 /100 | #304 | Tragic 96.9% |
| Nicaraguans | 0.0 /100 | #305 | Tragic 96.9% |
| Immigrants | Somalia | 0.0 /100 | #306 | Tragic 96.9% |
| Immigrants | Azores | 0.0 /100 | #307 | Tragic 96.8% |
| Immigrants | Haiti | 0.0 /100 | #308 | Tragic 96.8% |
| Belizeans | 0.0 /100 | #309 | Tragic 96.8% |
| Sri Lankans | 0.0 /100 | #310 | Tragic 96.8% |
| Guyanese | 0.0 /100 | #311 | Tragic 96.8% |
| Cape Verdeans | 0.0 /100 | #312 | Tragic 96.8% |
| Hispanics or Latinos | 0.0 /100 | #313 | Tragic 96.8% |
Demographics Similar to Colombians by 2nd Grade
In terms of 2nd grade, the demographic groups most similar to Colombians are Immigrants from Malaysia (97.6%, a difference of 0.0%), Immigrants from Pakistan (97.6%, a difference of 0.010%), Immigrants from Western Asia (97.6%, a difference of 0.010%), Immigrants from Uruguay (97.6%, a difference of 0.010%), and Nigerian (97.6%, a difference of 0.010%).
| Demographics | Rating | Rank | 2nd Grade |
| Sub-Saharan Africans | 3.4 /100 | #228 | Tragic 97.6% |
| Immigrants | Costa Rica | 3.1 /100 | #229 | Tragic 97.6% |
| Senegalese | 3.1 /100 | #230 | Tragic 97.6% |
| Immigrants | Pakistan | 2.3 /100 | #231 | Tragic 97.6% |
| Immigrants | Western Asia | 2.1 /100 | #232 | Tragic 97.6% |
| Immigrants | Uruguay | 2.1 /100 | #233 | Tragic 97.6% |
| Immigrants | Malaysia | 2.0 /100 | #234 | Tragic 97.6% |
| Colombians | 1.9 /100 | #235 | Tragic 97.6% |
| Nigerians | 1.7 /100 | #236 | Tragic 97.6% |
| U.S. Virgin Islanders | 1.6 /100 | #237 | Tragic 97.6% |
| Immigrants | Eastern Asia | 1.6 /100 | #238 | Tragic 97.6% |
| Liberians | 1.6 /100 | #239 | Tragic 97.6% |
| Koreans | 1.5 /100 | #240 | Tragic 97.5% |
| Ethiopians | 1.2 /100 | #241 | Tragic 97.5% |
| Immigrants | Indonesia | 1.2 /100 | #242 | Tragic 97.5% |