Immigrants from Singapore vs Norwegian 7th Grade
COMPARE
Immigrants from Singapore
Norwegian
7th Grade
7th Grade Comparison
Immigrants from Singapore
Norwegians
96.6%
7TH GRADE
98.3/ 100
METRIC RATING
103rd/ 347
METRIC RANK
97.8%
7TH GRADE
100.0/ 100
METRIC RATING
7th/ 347
METRIC RANK
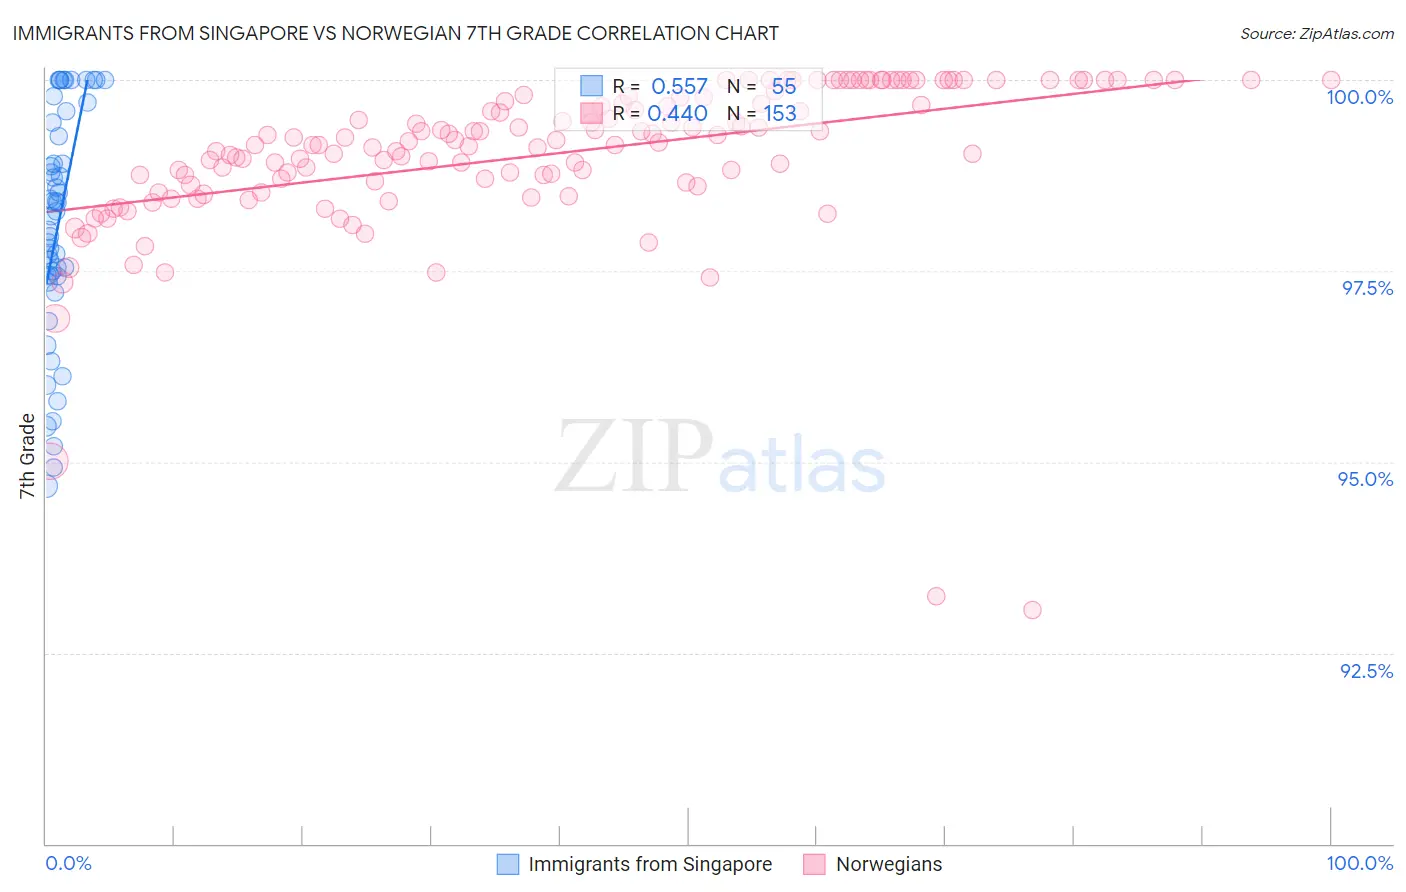
Immigrants from Singapore vs Norwegian 7th Grade Correlation Chart
The statistical analysis conducted on geographies consisting of 137,519,875 people shows a substantial positive correlation between the proportion of Immigrants from Singapore and percentage of population with at least 7th grade education in the United States with a correlation coefficient (R) of 0.557 and weighted average of 96.6%. Similarly, the statistical analysis conducted on geographies consisting of 533,395,759 people shows a moderate positive correlation between the proportion of Norwegians and percentage of population with at least 7th grade education in the United States with a correlation coefficient (R) of 0.440 and weighted average of 97.8%, a difference of 1.2%.
7th Grade Correlation Summary
| Measurement | Immigrants from Singapore | Norwegian |
| Minimum | 94.7% | 93.1% |
| Maximum | 100.0% | 100.0% |
| Range | 5.3% | 6.9% |
| Mean | 98.1% | 99.0% |
| Median | 98.3% | 99.2% |
| Interquartile 25% (IQ1) | 97.4% | 98.6% |
| Interquartile 75% (IQ3) | 99.4% | 99.8% |
| Interquartile Range (IQR) | 2.0% | 1.1% |
| Standard Deviation (Sample) | 1.5% | 1.0% |
| Standard Deviation (Population) | 1.5% | 1.0% |
Similar Demographics by 7th Grade
Demographics Similar to Immigrants from Singapore by 7th Grade
In terms of 7th grade, the demographic groups most similar to Immigrants from Singapore are Immigrants from Czechoslovakia (96.6%, a difference of 0.0%), Shoshone (96.6%, a difference of 0.020%), South African (96.6%, a difference of 0.020%), German Russian (96.7%, a difference of 0.030%), and Thai (96.7%, a difference of 0.030%).
| Demographics | Rating | Rank | 7th Grade |
| Immigrants | Denmark | 98.7 /100 | #96 | Exceptional 96.7% |
| Immigrants | Germany | 98.7 /100 | #97 | Exceptional 96.7% |
| Immigrants | Sweden | 98.7 /100 | #98 | Exceptional 96.7% |
| Menominee | 98.7 /100 | #99 | Exceptional 96.7% |
| German Russians | 98.6 /100 | #100 | Exceptional 96.7% |
| Thais | 98.6 /100 | #101 | Exceptional 96.7% |
| Immigrants | Czechoslovakia | 98.3 /100 | #102 | Exceptional 96.6% |
| Immigrants | Singapore | 98.3 /100 | #103 | Exceptional 96.6% |
| Shoshone | 98.1 /100 | #104 | Exceptional 96.6% |
| South Africans | 98.0 /100 | #105 | Exceptional 96.6% |
| Iroquois | 97.9 /100 | #106 | Exceptional 96.6% |
| Lumbee | 97.8 /100 | #107 | Exceptional 96.6% |
| Immigrants | Saudi Arabia | 97.8 /100 | #108 | Exceptional 96.6% |
| Bhutanese | 97.7 /100 | #109 | Exceptional 96.6% |
| Okinawans | 97.4 /100 | #110 | Exceptional 96.6% |
Demographics Similar to Norwegians by 7th Grade
In terms of 7th grade, the demographic groups most similar to Norwegians are Slovak (97.8%, a difference of 0.010%), Tsimshian (97.8%, a difference of 0.030%), German (97.7%, a difference of 0.030%), Dutch (97.9%, a difference of 0.090%), and Slovene (97.6%, a difference of 0.14%).
| Demographics | Rating | Rank | 7th Grade |
| Crow | 100.0 /100 | #1 | Exceptional 99.1% |
| Finns | 100.0 /100 | #2 | Exceptional 98.5% |
| Carpatho Rusyns | 100.0 /100 | #3 | Exceptional 98.3% |
| Ottawa | 100.0 /100 | #4 | Exceptional 98.1% |
| Dutch | 100.0 /100 | #5 | Exceptional 97.9% |
| Tsimshian | 100.0 /100 | #6 | Exceptional 97.8% |
| Norwegians | 100.0 /100 | #7 | Exceptional 97.8% |
| Slovaks | 100.0 /100 | #8 | Exceptional 97.8% |
| Germans | 100.0 /100 | #9 | Exceptional 97.7% |
| Slovenes | 100.0 /100 | #10 | Exceptional 97.6% |
| Alaskan Athabascans | 100.0 /100 | #11 | Exceptional 97.6% |
| Poles | 100.0 /100 | #12 | Exceptional 97.6% |
| Swedes | 100.0 /100 | #13 | Exceptional 97.6% |
| Pennsylvania Germans | 100.0 /100 | #14 | Exceptional 97.6% |
| English | 100.0 /100 | #15 | Exceptional 97.6% |