Immigrants from Singapore vs Inupiat 12th Grade, No Diploma
COMPARE
Immigrants from Singapore
Inupiat
12th Grade, No Diploma
12th Grade, No Diploma Comparison
Immigrants from Singapore
Inupiat
93.3%
12TH GRADE, NO DIPLOMA
99.9/ 100
METRIC RATING
18th/ 347
METRIC RANK
90.1%
12TH GRADE, NO DIPLOMA
2.0/ 100
METRIC RATING
238th/ 347
METRIC RANK
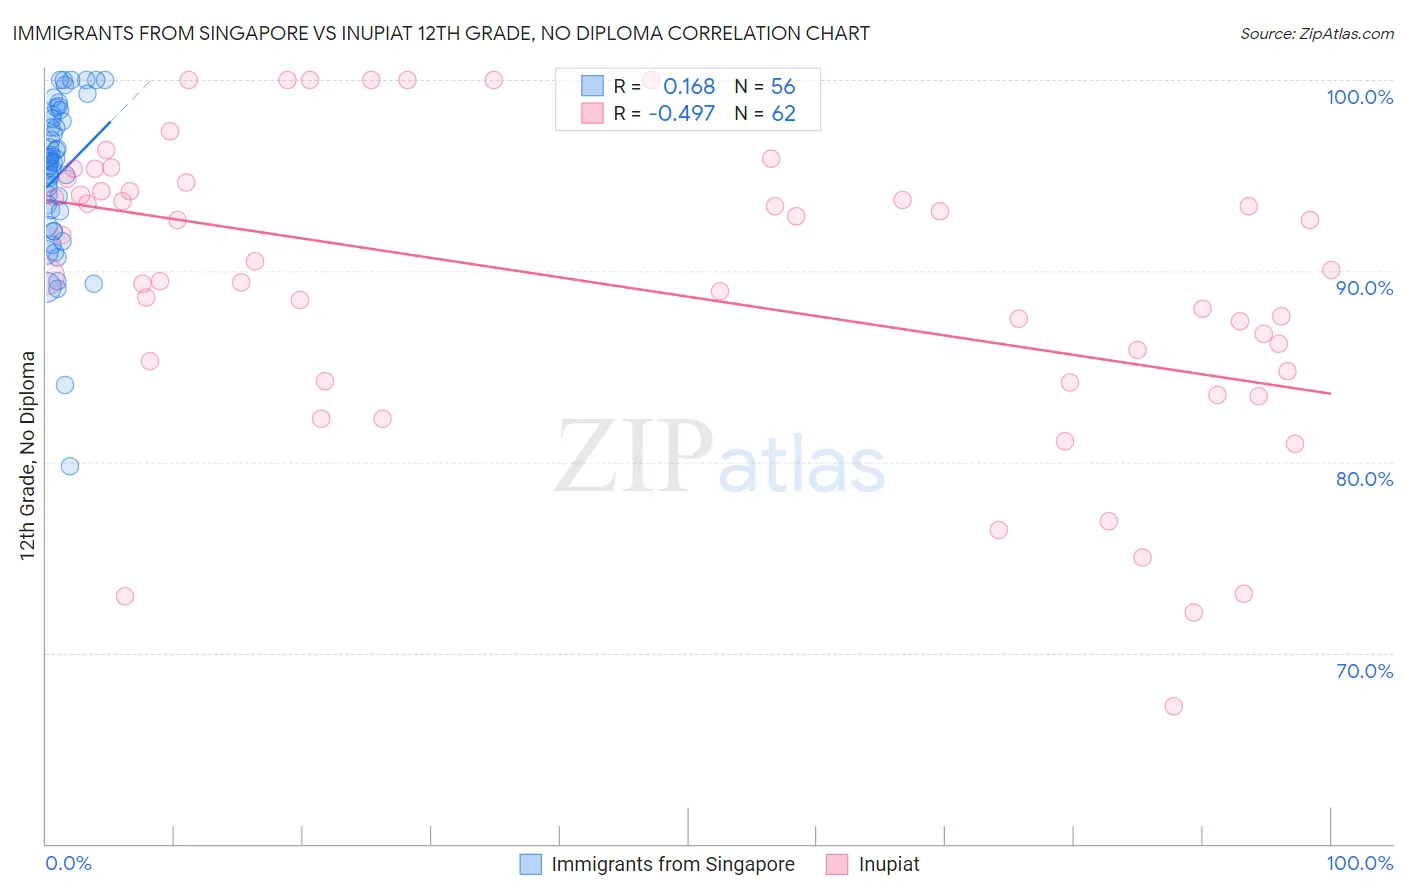
Immigrants from Singapore vs Inupiat 12th Grade, No Diploma Correlation Chart
The statistical analysis conducted on geographies consisting of 137,521,094 people shows a poor positive correlation between the proportion of Immigrants from Singapore and percentage of population with at least 12th grade (no diploma) education in the United States with a correlation coefficient (R) of 0.168 and weighted average of 93.3%. Similarly, the statistical analysis conducted on geographies consisting of 96,349,180 people shows a moderate negative correlation between the proportion of Inupiat and percentage of population with at least 12th grade (no diploma) education in the United States with a correlation coefficient (R) of -0.497 and weighted average of 90.1%, a difference of 3.6%.
12th Grade, No Diploma Correlation Summary
| Measurement | Immigrants from Singapore | Inupiat |
| Minimum | 79.8% | 67.2% |
| Maximum | 100.0% | 100.0% |
| Range | 20.2% | 32.8% |
| Mean | 95.0% | 89.2% |
| Median | 95.7% | 89.9% |
| Interquartile 25% (IQ1) | 92.7% | 84.7% |
| Interquartile 75% (IQ3) | 98.1% | 94.2% |
| Interquartile Range (IQR) | 5.4% | 9.5% |
| Standard Deviation (Sample) | 4.1% | 7.7% |
| Standard Deviation (Population) | 4.0% | 7.7% |
Similar Demographics by 12th Grade, No Diploma
Demographics Similar to Immigrants from Singapore by 12th Grade, No Diploma
In terms of 12th grade, no diploma, the demographic groups most similar to Immigrants from Singapore are German (93.3%, a difference of 0.020%), Luxembourger (93.3%, a difference of 0.030%), Maltese (93.3%, a difference of 0.050%), Filipino (93.2%, a difference of 0.050%), and Italian (93.2%, a difference of 0.070%).
| Demographics | Rating | Rank | 12th Grade, No Diploma |
| Poles | 100.0 /100 | #11 | Exceptional 93.5% |
| Eastern Europeans | 100.0 /100 | #12 | Exceptional 93.5% |
| Danes | 100.0 /100 | #13 | Exceptional 93.5% |
| Bulgarians | 100.0 /100 | #14 | Exceptional 93.5% |
| Finns | 100.0 /100 | #15 | Exceptional 93.4% |
| Maltese | 100.0 /100 | #16 | Exceptional 93.3% |
| Luxembourgers | 100.0 /100 | #17 | Exceptional 93.3% |
| Immigrants | Singapore | 99.9 /100 | #18 | Exceptional 93.3% |
| Germans | 99.9 /100 | #19 | Exceptional 93.3% |
| Filipinos | 99.9 /100 | #20 | Exceptional 93.2% |
| Italians | 99.9 /100 | #21 | Exceptional 93.2% |
| Estonians | 99.9 /100 | #22 | Exceptional 93.2% |
| Scandinavians | 99.9 /100 | #23 | Exceptional 93.2% |
| Thais | 99.9 /100 | #24 | Exceptional 93.2% |
| Czechs | 99.9 /100 | #25 | Exceptional 93.2% |
Demographics Similar to Inupiat by 12th Grade, No Diploma
In terms of 12th grade, no diploma, the demographic groups most similar to Inupiat are Immigrants from Colombia (90.1%, a difference of 0.010%), Subsaharan African (90.1%, a difference of 0.020%), Immigrants from Thailand (90.1%, a difference of 0.040%), Immigrants from South America (90.1%, a difference of 0.040%), and Colville (90.1%, a difference of 0.040%).
| Demographics | Rating | Rank | 12th Grade, No Diploma |
| Peruvians | 2.7 /100 | #231 | Tragic 90.2% |
| Blackfeet | 2.4 /100 | #232 | Tragic 90.1% |
| Immigrants | Thailand | 2.3 /100 | #233 | Tragic 90.1% |
| Immigrants | South America | 2.3 /100 | #234 | Tragic 90.1% |
| Colville | 2.3 /100 | #235 | Tragic 90.1% |
| Immigrants | Uzbekistan | 2.2 /100 | #236 | Tragic 90.1% |
| Immigrants | Colombia | 2.1 /100 | #237 | Tragic 90.1% |
| Inupiat | 2.0 /100 | #238 | Tragic 90.1% |
| Sub-Saharan Africans | 1.9 /100 | #239 | Tragic 90.1% |
| Kiowa | 1.7 /100 | #240 | Tragic 90.0% |
| Immigrants | Middle Africa | 1.7 /100 | #241 | Tragic 90.0% |
| Immigrants | Costa Rica | 1.6 /100 | #242 | Tragic 90.0% |
| Crow | 1.5 /100 | #243 | Tragic 90.0% |
| Taiwanese | 1.5 /100 | #244 | Tragic 90.0% |
| Immigrants | Uruguay | 1.4 /100 | #245 | Tragic 90.0% |