Immigrants from Singapore vs Immigrants from Netherlands 6th Grade
COMPARE
Immigrants from Singapore
Immigrants from Netherlands
6th Grade
6th Grade Comparison
Immigrants from Singapore
Immigrants from Netherlands
97.5%
6TH GRADE
97.6/ 100
METRIC RATING
107th/ 347
METRIC RANK
97.6%
6TH GRADE
99.4/ 100
METRIC RATING
74th/ 347
METRIC RANK
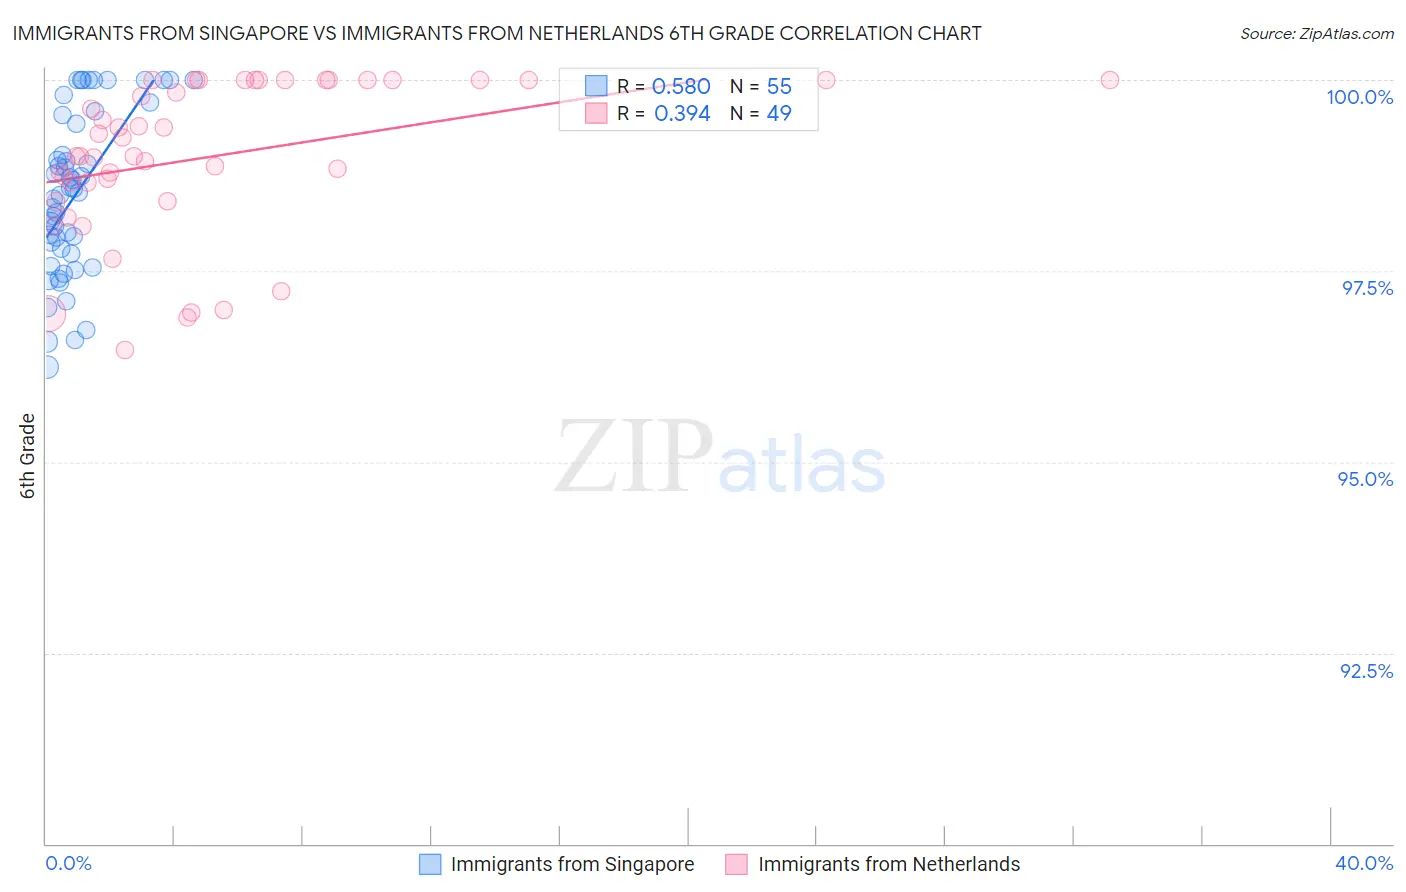
Immigrants from Singapore vs Immigrants from Netherlands 6th Grade Correlation Chart
The statistical analysis conducted on geographies consisting of 137,519,875 people shows a substantial positive correlation between the proportion of Immigrants from Singapore and percentage of population with at least 6th grade education in the United States with a correlation coefficient (R) of 0.580 and weighted average of 97.5%. Similarly, the statistical analysis conducted on geographies consisting of 237,869,709 people shows a mild positive correlation between the proportion of Immigrants from Netherlands and percentage of population with at least 6th grade education in the United States with a correlation coefficient (R) of 0.394 and weighted average of 97.6%, a difference of 0.16%.
6th Grade Correlation Summary
| Measurement | Immigrants from Singapore | Immigrants from Netherlands |
| Minimum | 96.2% | 96.5% |
| Maximum | 100.0% | 100.0% |
| Range | 3.8% | 3.5% |
| Mean | 98.5% | 99.0% |
| Median | 98.5% | 99.0% |
| Interquartile 25% (IQ1) | 97.7% | 98.5% |
| Interquartile 75% (IQ3) | 99.5% | 100.0% |
| Interquartile Range (IQR) | 1.8% | 1.5% |
| Standard Deviation (Sample) | 1.1% | 1.0% |
| Standard Deviation (Population) | 1.0% | 1.0% |
Similar Demographics by 6th Grade
Demographics Similar to Immigrants from Singapore by 6th Grade
In terms of 6th grade, the demographic groups most similar to Immigrants from Singapore are Menominee (97.5%, a difference of 0.010%), Nonimmigrants (97.4%, a difference of 0.010%), Immigrants from Czechoslovakia (97.4%, a difference of 0.010%), Choctaw (97.5%, a difference of 0.020%), and Bhutanese (97.5%, a difference of 0.020%).
| Demographics | Rating | Rank | 6th Grade |
| Turks | 98.3 /100 | #100 | Exceptional 97.5% |
| South Africans | 98.2 /100 | #101 | Exceptional 97.5% |
| Choctaw | 98.0 /100 | #102 | Exceptional 97.5% |
| Bhutanese | 98.0 /100 | #103 | Exceptional 97.5% |
| German Russians | 97.9 /100 | #104 | Exceptional 97.5% |
| Cheyenne | 97.9 /100 | #105 | Exceptional 97.5% |
| Menominee | 97.7 /100 | #106 | Exceptional 97.5% |
| Immigrants | Singapore | 97.6 /100 | #107 | Exceptional 97.5% |
| Immigrants | Nonimmigrants | 97.3 /100 | #108 | Exceptional 97.4% |
| Immigrants | Czechoslovakia | 97.3 /100 | #109 | Exceptional 97.4% |
| Thais | 96.9 /100 | #110 | Exceptional 97.4% |
| Iroquois | 96.9 /100 | #111 | Exceptional 97.4% |
| Immigrants | Latvia | 96.7 /100 | #112 | Exceptional 97.4% |
| Immigrants | Saudi Arabia | 96.5 /100 | #113 | Exceptional 97.4% |
| Colville | 96.4 /100 | #114 | Exceptional 97.4% |
Demographics Similar to Immigrants from Netherlands by 6th Grade
In terms of 6th grade, the demographic groups most similar to Immigrants from Netherlands are Ukrainian (97.6%, a difference of 0.0%), Chickasaw (97.6%, a difference of 0.010%), Macedonian (97.6%, a difference of 0.010%), Cherokee (97.6%, a difference of 0.010%), and Immigrants from England (97.6%, a difference of 0.010%).
| Demographics | Rating | Rank | 6th Grade |
| Kiowa | 99.6 /100 | #67 | Exceptional 97.7% |
| Immigrants | Austria | 99.6 /100 | #68 | Exceptional 97.7% |
| Iranians | 99.6 /100 | #69 | Exceptional 97.6% |
| Cajuns | 99.5 /100 | #70 | Exceptional 97.6% |
| Chickasaw | 99.5 /100 | #71 | Exceptional 97.6% |
| Macedonians | 99.4 /100 | #72 | Exceptional 97.6% |
| Cherokee | 99.4 /100 | #73 | Exceptional 97.6% |
| Immigrants | Netherlands | 99.4 /100 | #74 | Exceptional 97.6% |
| Ukrainians | 99.4 /100 | #75 | Exceptional 97.6% |
| Immigrants | England | 99.4 /100 | #76 | Exceptional 97.6% |
| Immigrants | Lithuania | 99.3 /100 | #77 | Exceptional 97.6% |
| Icelanders | 99.3 /100 | #78 | Exceptional 97.6% |
| Immigrants | India | 99.3 /100 | #79 | Exceptional 97.6% |
| Osage | 99.3 /100 | #80 | Exceptional 97.6% |
| Lumbee | 99.2 /100 | #81 | Exceptional 97.6% |