Immigrants from Serbia vs Armenian 2nd Grade
COMPARE
Immigrants from Serbia
Armenian
2nd Grade
2nd Grade Comparison
Immigrants from Serbia
Armenians
98.1%
2ND GRADE
92.3/ 100
METRIC RATING
128th/ 347
METRIC RANK
97.5%
2ND GRADE
0.5/ 100
METRIC RATING
261st/ 347
METRIC RANK
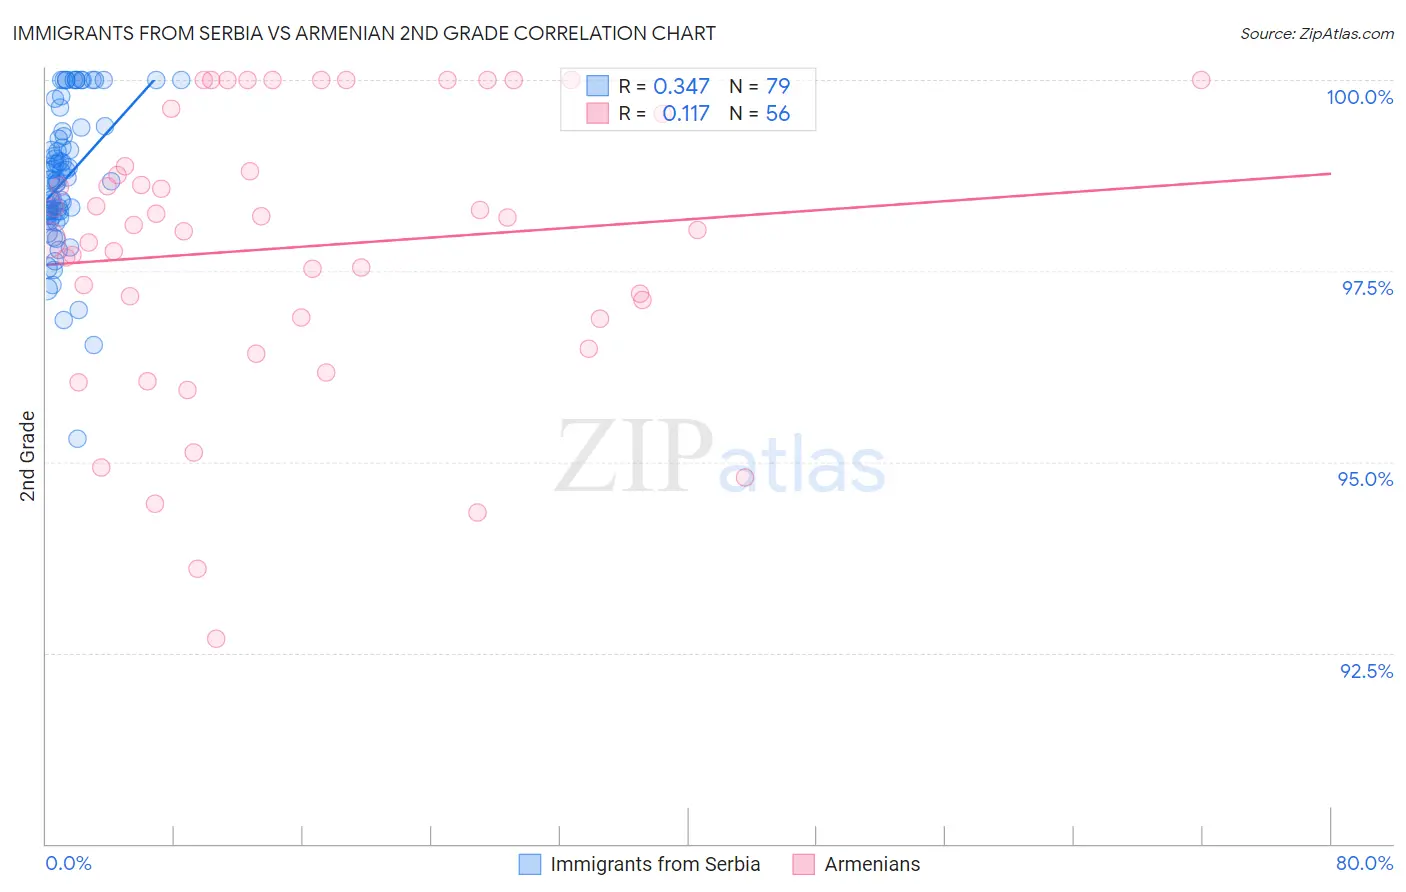
Immigrants from Serbia vs Armenian 2nd Grade Correlation Chart
The statistical analysis conducted on geographies consisting of 131,729,423 people shows a mild positive correlation between the proportion of Immigrants from Serbia and percentage of population with at least 2nd grade education in the United States with a correlation coefficient (R) of 0.347 and weighted average of 98.1%. Similarly, the statistical analysis conducted on geographies consisting of 310,954,660 people shows a poor positive correlation between the proportion of Armenians and percentage of population with at least 2nd grade education in the United States with a correlation coefficient (R) of 0.117 and weighted average of 97.5%, a difference of 0.62%.
2nd Grade Correlation Summary
| Measurement | Immigrants from Serbia | Armenian |
| Minimum | 95.3% | 92.7% |
| Maximum | 100.0% | 100.0% |
| Range | 4.7% | 7.3% |
| Mean | 98.7% | 97.8% |
| Median | 98.7% | 98.1% |
| Interquartile 25% (IQ1) | 98.2% | 96.9% |
| Interquartile 75% (IQ3) | 99.3% | 99.2% |
| Interquartile Range (IQR) | 1.1% | 2.3% |
| Standard Deviation (Sample) | 0.93% | 1.8% |
| Standard Deviation (Population) | 0.92% | 1.8% |
Similar Demographics by 2nd Grade
Demographics Similar to Immigrants from Serbia by 2nd Grade
In terms of 2nd grade, the demographic groups most similar to Immigrants from Serbia are Immigrants from Croatia (98.1%, a difference of 0.0%), Seminole (98.0%, a difference of 0.010%), Immigrants from Europe (98.0%, a difference of 0.010%), Lebanese (98.1%, a difference of 0.020%), and Immigrants from Japan (98.1%, a difference of 0.020%).
| Demographics | Rating | Rank | 2nd Grade |
| Immigrants | Zimbabwe | 94.4 /100 | #121 | Exceptional 98.1% |
| Lebanese | 94.2 /100 | #122 | Exceptional 98.1% |
| Immigrants | Japan | 94.1 /100 | #123 | Exceptional 98.1% |
| Menominee | 94.1 /100 | #124 | Exceptional 98.1% |
| Iroquois | 94.1 /100 | #125 | Exceptional 98.1% |
| Syrians | 94.0 /100 | #126 | Exceptional 98.1% |
| Immigrants | Saudi Arabia | 93.6 /100 | #127 | Exceptional 98.1% |
| Immigrants | Serbia | 92.3 /100 | #128 | Exceptional 98.1% |
| Immigrants | Croatia | 92.1 /100 | #129 | Exceptional 98.1% |
| Seminole | 91.1 /100 | #130 | Exceptional 98.0% |
| Immigrants | Europe | 91.1 /100 | #131 | Exceptional 98.0% |
| Spaniards | 90.7 /100 | #132 | Exceptional 98.0% |
| Cambodians | 90.7 /100 | #133 | Exceptional 98.0% |
| Immigrants | Hungary | 89.7 /100 | #134 | Excellent 98.0% |
| Immigrants | Bulgaria | 89.7 /100 | #135 | Excellent 98.0% |
Demographics Similar to Armenians by 2nd Grade
In terms of 2nd grade, the demographic groups most similar to Armenians are Assyrian/Chaldean/Syriac (97.5%, a difference of 0.0%), Immigrants from Colombia (97.5%, a difference of 0.010%), Yaqui (97.5%, a difference of 0.010%), Fijian (97.5%, a difference of 0.010%), and Taiwanese (97.4%, a difference of 0.010%).
| Demographics | Rating | Rank | 2nd Grade |
| Indians (Asian) | 0.6 /100 | #254 | Tragic 97.5% |
| Immigrants | Congo | 0.6 /100 | #255 | Tragic 97.5% |
| Jamaicans | 0.6 /100 | #256 | Tragic 97.5% |
| Immigrants | Colombia | 0.5 /100 | #257 | Tragic 97.5% |
| Yaqui | 0.5 /100 | #258 | Tragic 97.5% |
| Fijians | 0.5 /100 | #259 | Tragic 97.5% |
| Assyrians/Chaldeans/Syriacs | 0.5 /100 | #260 | Tragic 97.5% |
| Armenians | 0.5 /100 | #261 | Tragic 97.5% |
| Taiwanese | 0.4 /100 | #262 | Tragic 97.4% |
| Immigrants | Ethiopia | 0.4 /100 | #263 | Tragic 97.4% |
| Immigrants | Liberia | 0.4 /100 | #264 | Tragic 97.4% |
| Immigrants | South America | 0.4 /100 | #265 | Tragic 97.4% |
| Immigrants | Sierra Leone | 0.4 /100 | #266 | Tragic 97.4% |
| Cubans | 0.3 /100 | #267 | Tragic 97.4% |
| Immigrants | Nigeria | 0.3 /100 | #268 | Tragic 97.4% |