Immigrants from Senegal vs Latvian 5th Grade
COMPARE
Immigrants from Senegal
Latvian
5th Grade
5th Grade Comparison
Immigrants from Senegal
Latvians
96.8%
5TH GRADE
0.8/ 100
METRIC RATING
254th/ 347
METRIC RANK
98.1%
5TH GRADE
99.9/ 100
METRIC RATING
37th/ 347
METRIC RANK
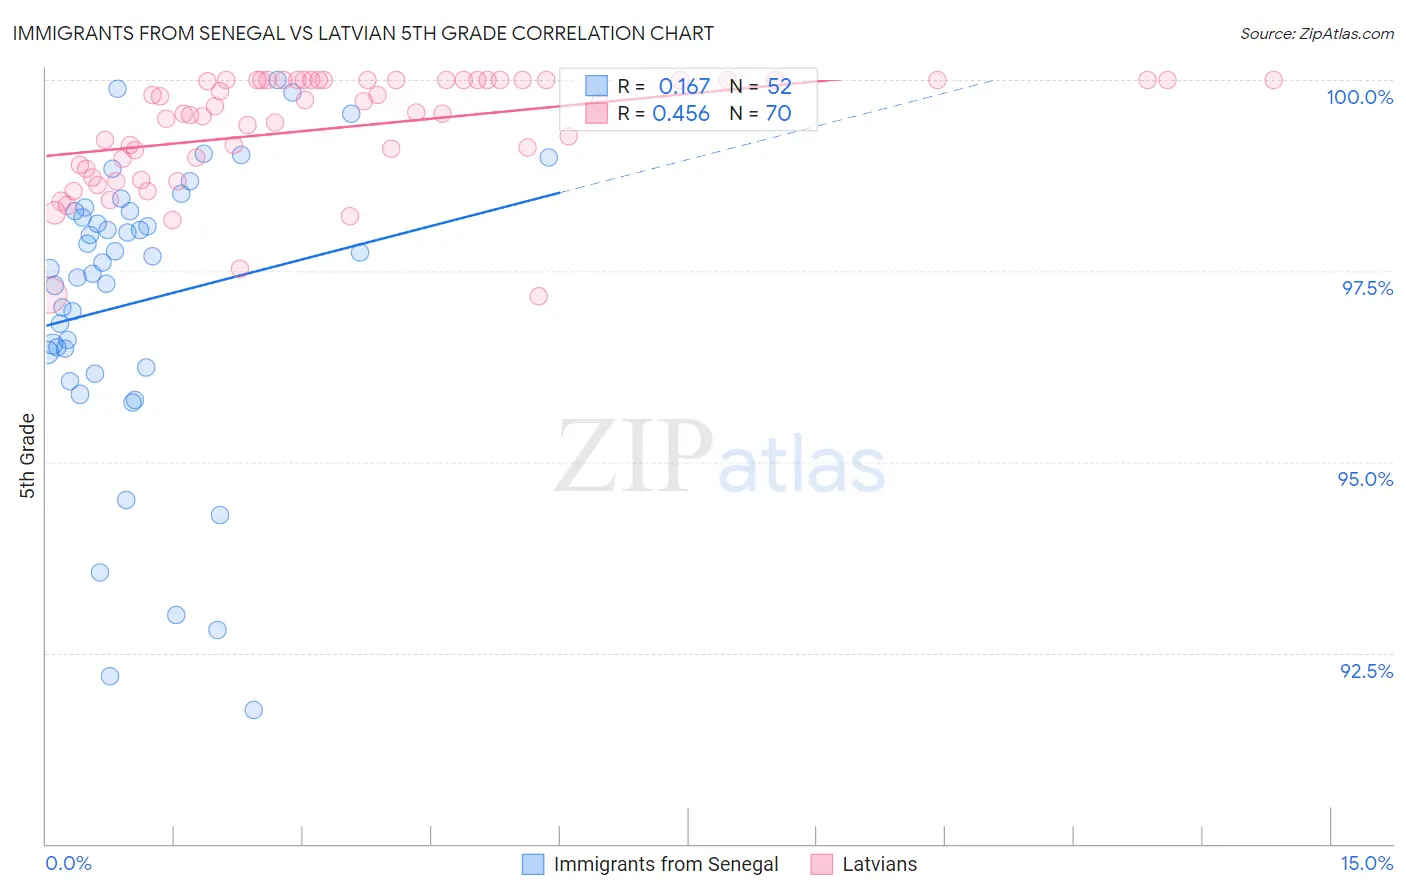
Immigrants from Senegal vs Latvian 5th Grade Correlation Chart
The statistical analysis conducted on geographies consisting of 90,130,297 people shows a poor positive correlation between the proportion of Immigrants from Senegal and percentage of population with at least 5th grade education in the United States with a correlation coefficient (R) of 0.167 and weighted average of 96.8%. Similarly, the statistical analysis conducted on geographies consisting of 220,726,452 people shows a moderate positive correlation between the proportion of Latvians and percentage of population with at least 5th grade education in the United States with a correlation coefficient (R) of 0.456 and weighted average of 98.1%, a difference of 1.3%.
5th Grade Correlation Summary
| Measurement | Immigrants from Senegal | Latvian |
| Minimum | 91.8% | 97.2% |
| Maximum | 100.0% | 100.0% |
| Range | 8.2% | 2.8% |
| Mean | 97.1% | 99.4% |
| Median | 97.6% | 99.6% |
| Interquartile 25% (IQ1) | 96.3% | 98.9% |
| Interquartile 75% (IQ3) | 98.3% | 100.0% |
| Interquartile Range (IQR) | 1.9% | 1.1% |
| Standard Deviation (Sample) | 1.9% | 0.73% |
| Standard Deviation (Population) | 1.9% | 0.73% |
Similar Demographics by 5th Grade
Demographics Similar to Immigrants from Senegal by 5th Grade
In terms of 5th grade, the demographic groups most similar to Immigrants from Senegal are Immigrants from Middle Africa (96.8%, a difference of 0.010%), Immigrants from Uruguay (96.9%, a difference of 0.020%), Immigrants from Liberia (96.9%, a difference of 0.020%), Bolivian (96.9%, a difference of 0.020%), and Jamaican (96.9%, a difference of 0.020%).
| Demographics | Rating | Rank | 5th Grade |
| Immigrants | Africa | 1.1 /100 | #247 | Tragic 96.9% |
| U.S. Virgin Islanders | 1.1 /100 | #248 | Tragic 96.9% |
| Immigrants | Uruguay | 1.0 /100 | #249 | Tragic 96.9% |
| Immigrants | Liberia | 1.0 /100 | #250 | Tragic 96.9% |
| Bolivians | 0.9 /100 | #251 | Tragic 96.9% |
| Jamaicans | 0.9 /100 | #252 | Tragic 96.9% |
| Immigrants | Middle Africa | 0.8 /100 | #253 | Tragic 96.8% |
| Immigrants | Senegal | 0.8 /100 | #254 | Tragic 96.8% |
| South Americans | 0.7 /100 | #255 | Tragic 96.8% |
| Immigrants | Congo | 0.7 /100 | #256 | Tragic 96.8% |
| Peruvians | 0.6 /100 | #257 | Tragic 96.8% |
| Immigrants | Ethiopia | 0.5 /100 | #258 | Tragic 96.8% |
| Immigrants | China | 0.5 /100 | #259 | Tragic 96.8% |
| Immigrants | Jamaica | 0.4 /100 | #260 | Tragic 96.8% |
| Immigrants | Sierra Leone | 0.4 /100 | #261 | Tragic 96.8% |
Demographics Similar to Latvians by 5th Grade
In terms of 5th grade, the demographic groups most similar to Latvians are Belgian (98.1%, a difference of 0.010%), Luxembourger (98.1%, a difference of 0.010%), British (98.1%, a difference of 0.020%), Eastern European (98.1%, a difference of 0.020%), and Italian (98.1%, a difference of 0.030%).
| Demographics | Rating | Rank | 5th Grade |
| French Canadians | 100.0 /100 | #30 | Exceptional 98.2% |
| Europeans | 100.0 /100 | #31 | Exceptional 98.2% |
| Chippewa | 100.0 /100 | #32 | Exceptional 98.1% |
| Swiss | 100.0 /100 | #33 | Exceptional 98.1% |
| Chinese | 100.0 /100 | #34 | Exceptional 98.1% |
| Italians | 100.0 /100 | #35 | Exceptional 98.1% |
| British | 100.0 /100 | #36 | Exceptional 98.1% |
| Latvians | 99.9 /100 | #37 | Exceptional 98.1% |
| Belgians | 99.9 /100 | #38 | Exceptional 98.1% |
| Luxembourgers | 99.9 /100 | #39 | Exceptional 98.1% |
| Eastern Europeans | 99.9 /100 | #40 | Exceptional 98.1% |
| Hungarians | 99.9 /100 | #41 | Exceptional 98.0% |
| Northern Europeans | 99.9 /100 | #42 | Exceptional 98.0% |
| Ottawa | 99.9 /100 | #43 | Exceptional 98.0% |
| Aleuts | 99.9 /100 | #44 | Exceptional 98.0% |