Immigrants from Senegal vs Immigrants from Israel Doctorate Degree
COMPARE
Immigrants from Senegal
Immigrants from Israel
Doctorate Degree
Doctorate Degree Comparison
Immigrants from Senegal
Immigrants from Israel
1.9%
DOCTORATE DEGREE
82.5/ 100
METRIC RATING
147th/ 347
METRIC RANK
3.0%
DOCTORATE DEGREE
100.0/ 100
METRIC RATING
8th/ 347
METRIC RANK
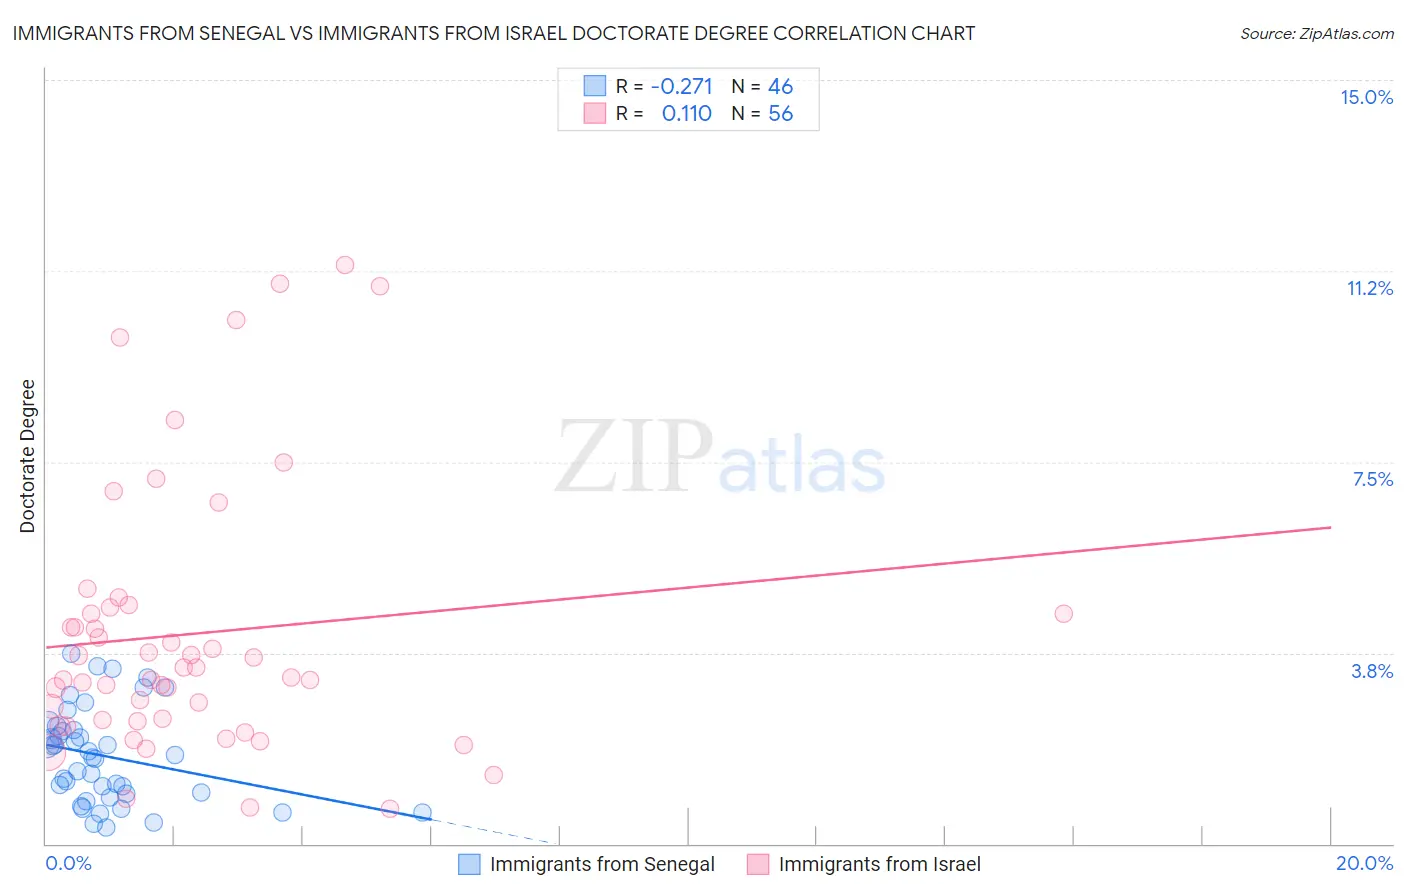
Immigrants from Senegal vs Immigrants from Israel Doctorate Degree Correlation Chart
The statistical analysis conducted on geographies consisting of 89,977,778 people shows a weak negative correlation between the proportion of Immigrants from Senegal and percentage of population with at least doctorate degree education in the United States with a correlation coefficient (R) of -0.271 and weighted average of 1.9%. Similarly, the statistical analysis conducted on geographies consisting of 209,560,574 people shows a poor positive correlation between the proportion of Immigrants from Israel and percentage of population with at least doctorate degree education in the United States with a correlation coefficient (R) of 0.110 and weighted average of 3.0%, a difference of 56.8%.
Doctorate Degree Correlation Summary
| Measurement | Immigrants from Senegal | Immigrants from Israel |
| Minimum | 0.31% | 0.70% |
| Maximum | 3.7% | 11.4% |
| Range | 3.4% | 10.7% |
| Mean | 1.7% | 4.1% |
| Median | 1.7% | 3.4% |
| Interquartile 25% (IQ1) | 0.98% | 2.4% |
| Interquartile 75% (IQ3) | 2.2% | 4.6% |
| Interquartile Range (IQR) | 1.2% | 2.2% |
| Standard Deviation (Sample) | 0.92% | 2.6% |
| Standard Deviation (Population) | 0.91% | 2.6% |
Similar Demographics by Doctorate Degree
Demographics Similar to Immigrants from Senegal by Doctorate Degree
In terms of doctorate degree, the demographic groups most similar to Immigrants from Senegal are Immigrants from Syria (1.9%, a difference of 0.25%), Kenyan (1.9%, a difference of 0.27%), Luxembourger (1.9%, a difference of 0.33%), Immigrants from Moldova (2.0%, a difference of 0.45%), and Sierra Leonean (2.0%, a difference of 0.66%).
| Demographics | Rating | Rank | Doctorate Degree |
| Immigrants | Africa | 87.0 /100 | #140 | Excellent 2.0% |
| Senegalese | 86.7 /100 | #141 | Excellent 2.0% |
| Italians | 86.0 /100 | #142 | Excellent 2.0% |
| Sierra Leoneans | 85.1 /100 | #143 | Excellent 2.0% |
| Immigrants | Moldova | 84.3 /100 | #144 | Excellent 2.0% |
| Kenyans | 83.6 /100 | #145 | Excellent 1.9% |
| Immigrants | Syria | 83.6 /100 | #146 | Excellent 1.9% |
| Immigrants | Senegal | 82.5 /100 | #147 | Excellent 1.9% |
| Luxembourgers | 81.1 /100 | #148 | Excellent 1.9% |
| Basques | 76.9 /100 | #149 | Good 1.9% |
| English | 75.9 /100 | #150 | Good 1.9% |
| Albanians | 74.8 /100 | #151 | Good 1.9% |
| Immigrants | Kenya | 74.3 /100 | #152 | Good 1.9% |
| Immigrants | Oceania | 74.0 /100 | #153 | Good 1.9% |
| Immigrants | Albania | 72.8 /100 | #154 | Good 1.9% |
Demographics Similar to Immigrants from Israel by Doctorate Degree
In terms of doctorate degree, the demographic groups most similar to Immigrants from Israel are Immigrants from Iran (3.0%, a difference of 0.67%), Immigrants from China (3.1%, a difference of 1.3%), Immigrants from Switzerland (3.1%, a difference of 1.4%), Immigrants from Eastern Asia (3.0%, a difference of 2.8%), and Iranian (3.1%, a difference of 3.3%).
| Demographics | Rating | Rank | Doctorate Degree |
| Immigrants | Singapore | 100.0 /100 | #1 | Exceptional 3.7% |
| Filipinos | 100.0 /100 | #2 | Exceptional 3.4% |
| Okinawans | 100.0 /100 | #3 | Exceptional 3.3% |
| Immigrants | Taiwan | 100.0 /100 | #4 | Exceptional 3.2% |
| Iranians | 100.0 /100 | #5 | Exceptional 3.1% |
| Immigrants | Switzerland | 100.0 /100 | #6 | Exceptional 3.1% |
| Immigrants | China | 100.0 /100 | #7 | Exceptional 3.1% |
| Immigrants | Israel | 100.0 /100 | #8 | Exceptional 3.0% |
| Immigrants | Iran | 100.0 /100 | #9 | Exceptional 3.0% |
| Immigrants | Eastern Asia | 100.0 /100 | #10 | Exceptional 3.0% |
| Indians (Asian) | 100.0 /100 | #11 | Exceptional 2.9% |
| Immigrants | Belgium | 100.0 /100 | #12 | Exceptional 2.9% |
| Immigrants | Sweden | 100.0 /100 | #13 | Exceptional 2.9% |
| Immigrants | France | 100.0 /100 | #14 | Exceptional 2.9% |
| Immigrants | India | 100.0 /100 | #15 | Exceptional 2.8% |