Immigrants from Portugal vs Immigrants from Singapore Nursery School
COMPARE
Immigrants from Portugal
Immigrants from Singapore
Nursery School
Nursery School Comparison
Immigrants from Portugal
Immigrants from Singapore
97.4%
NURSERY SCHOOL
0.0/ 100
METRIC RATING
286th/ 347
METRIC RANK
98.2%
NURSERY SCHOOL
96.9/ 100
METRIC RATING
110th/ 347
METRIC RANK
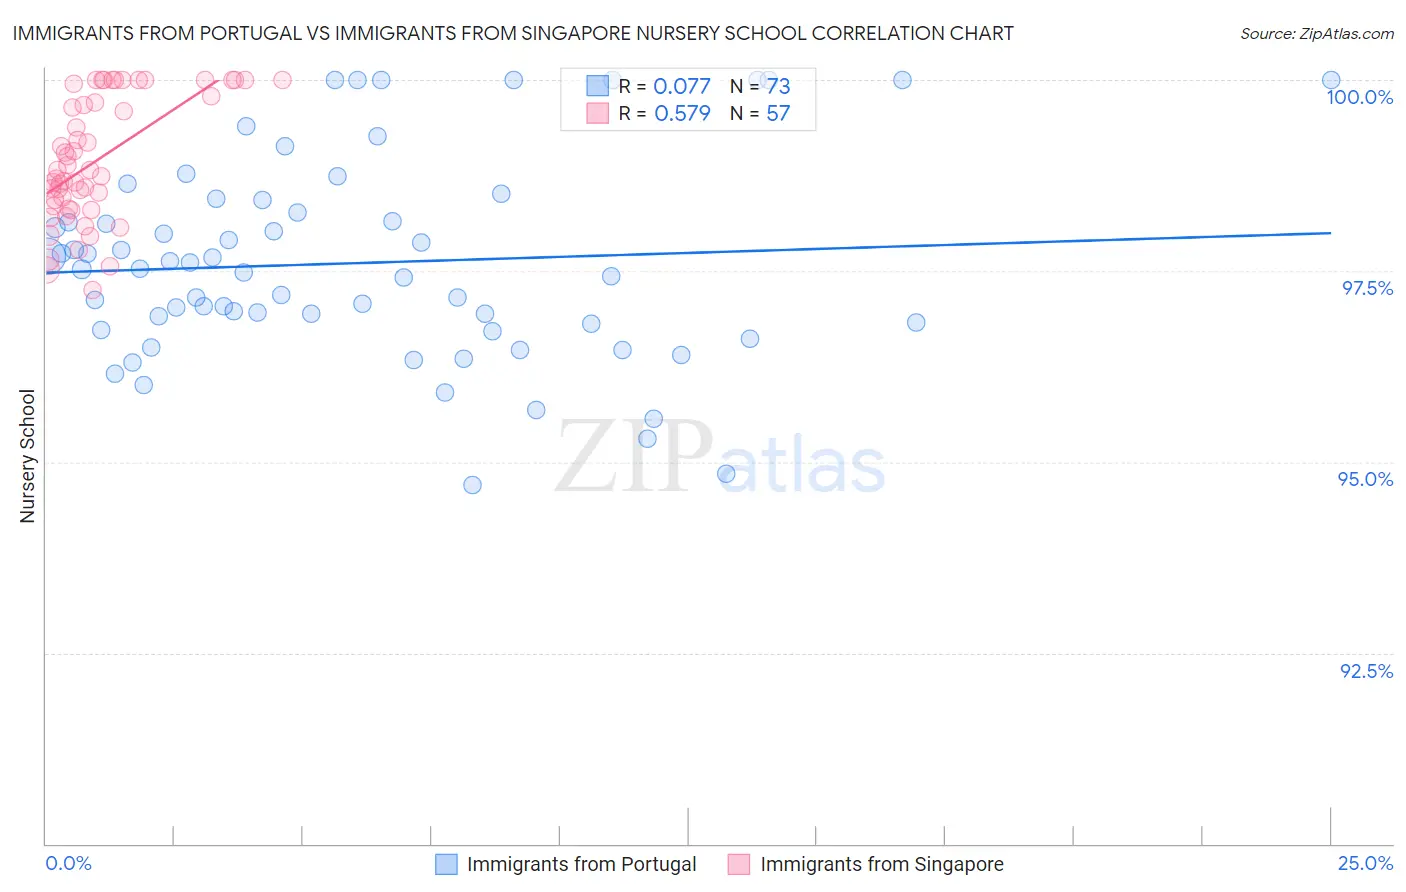
Immigrants from Portugal vs Immigrants from Singapore Nursery School Correlation Chart
The statistical analysis conducted on geographies consisting of 174,792,107 people shows a slight positive correlation between the proportion of Immigrants from Portugal and percentage of population with at least nursery school education in the United States with a correlation coefficient (R) of 0.077 and weighted average of 97.4%. Similarly, the statistical analysis conducted on geographies consisting of 137,521,700 people shows a substantial positive correlation between the proportion of Immigrants from Singapore and percentage of population with at least nursery school education in the United States with a correlation coefficient (R) of 0.579 and weighted average of 98.2%, a difference of 0.90%.
Nursery School Correlation Summary
| Measurement | Immigrants from Portugal | Immigrants from Singapore |
| Minimum | 94.7% | 97.2% |
| Maximum | 100.0% | 100.0% |
| Range | 5.3% | 2.8% |
| Mean | 97.6% | 99.0% |
| Median | 97.5% | 98.8% |
| Interquartile 25% (IQ1) | 96.8% | 98.3% |
| Interquartile 75% (IQ3) | 98.3% | 99.9% |
| Interquartile Range (IQR) | 1.6% | 1.5% |
| Standard Deviation (Sample) | 1.3% | 0.80% |
| Standard Deviation (Population) | 1.3% | 0.80% |
Similar Demographics by Nursery School
Demographics Similar to Immigrants from Portugal by Nursery School
In terms of nursery school, the demographic groups most similar to Immigrants from Portugal are Immigrants from Barbados (97.4%, a difference of 0.0%), Immigrants from Hong Kong (97.4%, a difference of 0.010%), Immigrants from West Indies (97.4%, a difference of 0.020%), Immigrants from Trinidad and Tobago (97.4%, a difference of 0.020%), and Immigrants from Thailand (97.3%, a difference of 0.020%).
| Demographics | Rating | Rank | Nursery School |
| Immigrants | Ghana | 0.1 /100 | #279 | Tragic 97.4% |
| Barbadians | 0.0 /100 | #280 | Tragic 97.4% |
| Trinidadians and Tobagonians | 0.0 /100 | #281 | Tragic 97.4% |
| Afghans | 0.0 /100 | #282 | Tragic 97.4% |
| Immigrants | West Indies | 0.0 /100 | #283 | Tragic 97.4% |
| Immigrants | Trinidad and Tobago | 0.0 /100 | #284 | Tragic 97.4% |
| Immigrants | Barbados | 0.0 /100 | #285 | Tragic 97.4% |
| Immigrants | Portugal | 0.0 /100 | #286 | Tragic 97.4% |
| Immigrants | Hong Kong | 0.0 /100 | #287 | Tragic 97.4% |
| Immigrants | Thailand | 0.0 /100 | #288 | Tragic 97.3% |
| Immigrants | St. Vincent and the Grenadines | 0.0 /100 | #289 | Tragic 97.3% |
| Immigrants | Afghanistan | 0.0 /100 | #290 | Tragic 97.3% |
| British West Indians | 0.0 /100 | #291 | Tragic 97.3% |
| Houma | 0.0 /100 | #292 | Tragic 97.3% |
| Malaysians | 0.0 /100 | #293 | Tragic 97.3% |
Demographics Similar to Immigrants from Singapore by Nursery School
In terms of nursery school, the demographic groups most similar to Immigrants from Singapore are Immigrants from Czechoslovakia (98.2%, a difference of 0.0%), Bhutanese (98.2%, a difference of 0.010%), Turkish (98.2%, a difference of 0.010%), Immigrants from Switzerland (98.2%, a difference of 0.010%), and Basque (98.2%, a difference of 0.010%).
| Demographics | Rating | Rank | Nursery School |
| Cree | 97.7 /100 | #103 | Exceptional 98.3% |
| Bhutanese | 97.4 /100 | #104 | Exceptional 98.2% |
| Turks | 97.4 /100 | #105 | Exceptional 98.2% |
| Immigrants | Switzerland | 97.3 /100 | #106 | Exceptional 98.2% |
| Basques | 97.3 /100 | #107 | Exceptional 98.2% |
| Pima | 97.1 /100 | #108 | Exceptional 98.2% |
| German Russians | 97.1 /100 | #109 | Exceptional 98.2% |
| Immigrants | Singapore | 96.9 /100 | #110 | Exceptional 98.2% |
| Immigrants | Czechoslovakia | 96.8 /100 | #111 | Exceptional 98.2% |
| Immigrants | Norway | 96.6 /100 | #112 | Exceptional 98.2% |
| Immigrants | Latvia | 96.4 /100 | #113 | Exceptional 98.2% |
| Ute | 96.4 /100 | #114 | Exceptional 98.2% |
| Iranians | 96.3 /100 | #115 | Exceptional 98.2% |
| Spanish | 95.8 /100 | #116 | Exceptional 98.2% |
| Immigrants | France | 95.6 /100 | #117 | Exceptional 98.2% |