Immigrants from Poland vs Immigrants from Sri Lanka Bachelor's Degree
COMPARE
Immigrants from Poland
Immigrants from Sri Lanka
Bachelor's Degree
Bachelor's Degree Comparison
Immigrants from Poland
Immigrants from Sri Lanka
39.0%
BACHELOR'S DEGREE
77.5/ 100
METRIC RATING
149th/ 347
METRIC RANK
46.1%
BACHELOR'S DEGREE
100.0/ 100
METRIC RATING
30th/ 347
METRIC RANK
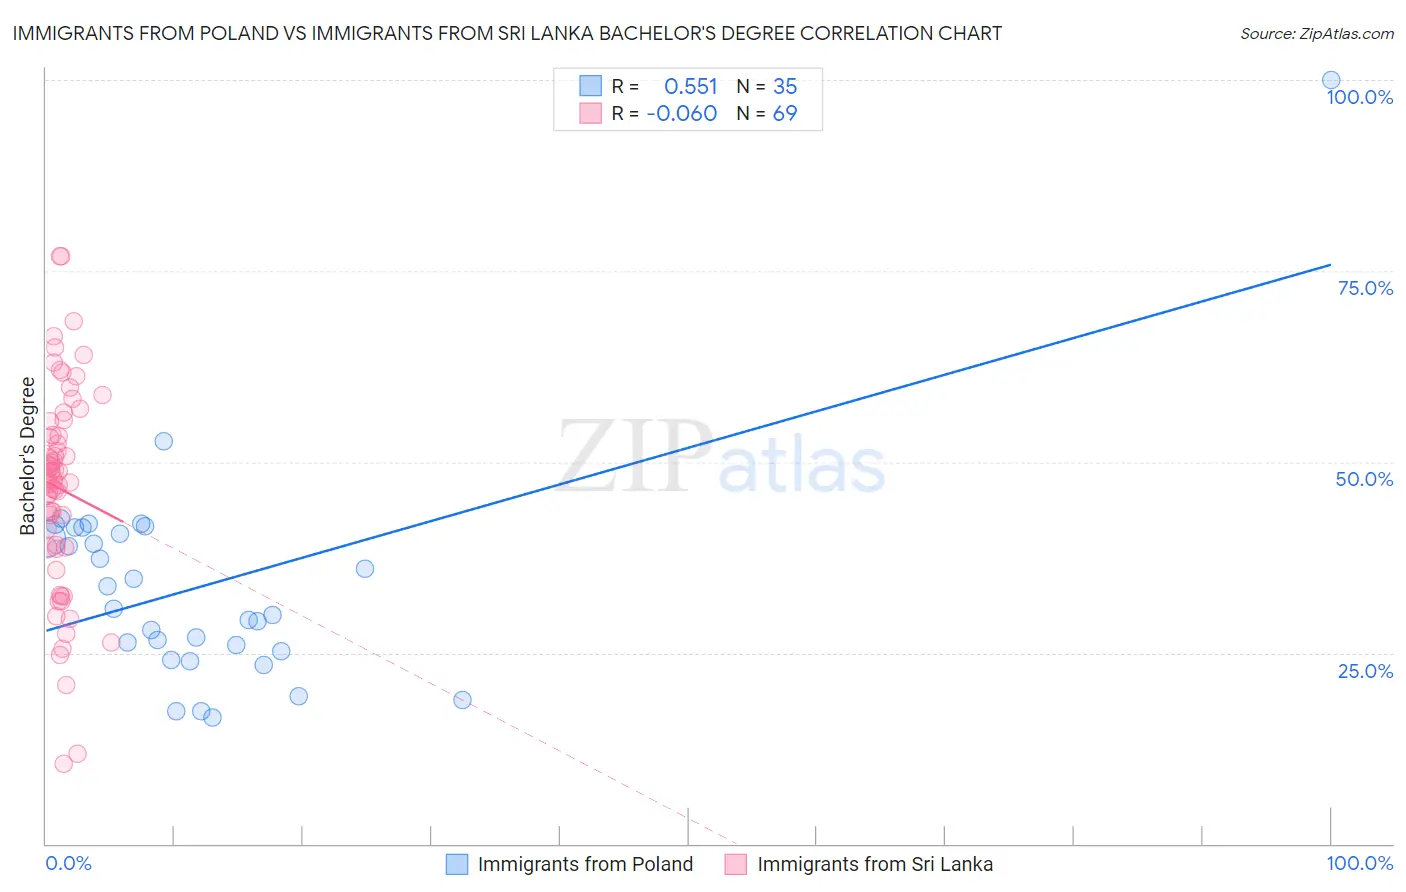
Immigrants from Poland vs Immigrants from Sri Lanka Bachelor's Degree Correlation Chart
The statistical analysis conducted on geographies consisting of 304,854,598 people shows a substantial positive correlation between the proportion of Immigrants from Poland and percentage of population with at least bachelor's degree education in the United States with a correlation coefficient (R) of 0.551 and weighted average of 39.0%. Similarly, the statistical analysis conducted on geographies consisting of 149,698,574 people shows a slight negative correlation between the proportion of Immigrants from Sri Lanka and percentage of population with at least bachelor's degree education in the United States with a correlation coefficient (R) of -0.060 and weighted average of 46.1%, a difference of 18.3%.
Bachelor's Degree Correlation Summary
| Measurement | Immigrants from Poland | Immigrants from Sri Lanka |
| Minimum | 16.6% | 10.5% |
| Maximum | 100.0% | 77.0% |
| Range | 83.4% | 66.5% |
| Mean | 33.8% | 46.5% |
| Median | 30.8% | 47.6% |
| Interquartile 25% (IQ1) | 25.2% | 38.7% |
| Interquartile 75% (IQ3) | 41.4% | 54.4% |
| Interquartile Range (IQR) | 16.2% | 15.6% |
| Standard Deviation (Sample) | 14.7% | 13.5% |
| Standard Deviation (Population) | 14.5% | 13.4% |
Similar Demographics by Bachelor's Degree
Demographics Similar to Immigrants from Poland by Bachelor's Degree
In terms of bachelor's degree, the demographic groups most similar to Immigrants from Poland are South American (38.9%, a difference of 0.030%), Iraqi (39.0%, a difference of 0.080%), Immigrants from Africa (38.9%, a difference of 0.13%), Sudanese (38.9%, a difference of 0.15%), and Slavic (38.9%, a difference of 0.20%).
| Demographics | Rating | Rank | Bachelor's Degree |
| Immigrants | North Macedonia | 81.6 /100 | #142 | Excellent 39.2% |
| Poles | 79.8 /100 | #143 | Good 39.1% |
| Immigrants | Afghanistan | 79.7 /100 | #144 | Good 39.1% |
| Slovenes | 79.5 /100 | #145 | Good 39.1% |
| Swedes | 79.2 /100 | #146 | Good 39.1% |
| Immigrants | Sierra Leone | 79.0 /100 | #147 | Good 39.0% |
| Iraqis | 78.1 /100 | #148 | Good 39.0% |
| Immigrants | Poland | 77.5 /100 | #149 | Good 39.0% |
| South Americans | 77.3 /100 | #150 | Good 38.9% |
| Immigrants | Africa | 76.5 /100 | #151 | Good 38.9% |
| Sudanese | 76.4 /100 | #152 | Good 38.9% |
| Slavs | 75.9 /100 | #153 | Good 38.9% |
| Canadians | 75.0 /100 | #154 | Good 38.8% |
| Immigrants | Kenya | 73.8 /100 | #155 | Good 38.8% |
| Kenyans | 72.5 /100 | #156 | Good 38.7% |
Demographics Similar to Immigrants from Sri Lanka by Bachelor's Degree
In terms of bachelor's degree, the demographic groups most similar to Immigrants from Sri Lanka are Latvian (46.1%, a difference of 0.040%), Israeli (46.1%, a difference of 0.050%), Turkish (46.2%, a difference of 0.18%), Immigrants from Turkey (46.0%, a difference of 0.34%), and Immigrants from France (46.4%, a difference of 0.64%).
| Demographics | Rating | Rank | Bachelor's Degree |
| Immigrants | Sweden | 100.0 /100 | #23 | Exceptional 47.0% |
| Immigrants | Korea | 100.0 /100 | #24 | Exceptional 47.0% |
| Burmese | 100.0 /100 | #25 | Exceptional 46.9% |
| Immigrants | Japan | 100.0 /100 | #26 | Exceptional 46.8% |
| Immigrants | France | 100.0 /100 | #27 | Exceptional 46.4% |
| Turks | 100.0 /100 | #28 | Exceptional 46.2% |
| Israelis | 100.0 /100 | #29 | Exceptional 46.1% |
| Immigrants | Sri Lanka | 100.0 /100 | #30 | Exceptional 46.1% |
| Latvians | 100.0 /100 | #31 | Exceptional 46.1% |
| Immigrants | Turkey | 100.0 /100 | #32 | Exceptional 46.0% |
| Immigrants | Northern Europe | 100.0 /100 | #33 | Exceptional 45.6% |
| Immigrants | Denmark | 100.0 /100 | #34 | Exceptional 45.4% |
| Immigrants | Russia | 100.0 /100 | #35 | Exceptional 45.4% |
| Mongolians | 100.0 /100 | #36 | Exceptional 45.4% |
| Russians | 100.0 /100 | #37 | Exceptional 45.3% |