Immigrants from Poland vs Immigrants from Bolivia 7th Grade

COMPARE

Immigrants from Poland
Race
Ancestry
AfghanAfricanAlaska NativeAlaskan AthabascanAlbanianAleutAlsatianAmericanApacheArabArapahoArgentineanArmenianAssyrian/Chaldean/SyriacAustralianAustrianBahamianBangladeshiBarbadianBasqueBelgianBelizeanBermudanBhutaneseBlackfeetBolivianBrazilianBritishBritish West IndianBulgarianBurmeseCajunCambodianCanadianCape VerdeanCarpatho RusynCelticCentral AmericanCentral American IndianCherokeeCheyenneChickasawChileanChineseChippewaChoctawColombianColvilleComancheCosta RicanCreeCreekCroatianCrowCubanCypriotCzechCzechoslovakianDanishDelawareDominicanDutchDutch West IndianEastern EuropeanEcuadorianEgyptianEnglishEstonianEthiopianEuropeanFijianFilipinoFinnishFrenchFrench American IndianFrench CanadianGermanGerman RussianGhanaianGreekGuamanian/ChamorroGuatemalanGuyaneseHaitianHmongHonduranHopiHoumaHungarianIcelanderIndian (Asian)IndonesianInupiatIranianIraqiIrishIroquoisIsraeliItalianJamaicanJapaneseJordanianKenyanKiowaKoreanLaotianLatvianLebaneseLiberianLithuanianLumbeeLuxembourgerMacedonianMalaysianMalteseMarshalleseMenomineeMexicanMexican American IndianMongolianMoroccanNative HawaiianNavajoNepaleseNew ZealanderNicaraguanNigerianNorthern EuropeanNorwegianOkinawanOsageOttawaPaiutePakistaniPalestinianPanamanianParaguayanPennsylvania GermanPeruvianPimaPolishPortuguesePotawatomiPuebloPuerto RicanPuget Sound SalishRomanianRussianSalvadoranSamoanScandinavianScotch-IrishScottishSeminoleSenegaleseSerbianShoshoneSierra LeoneanSiouxSlavicSlovakSloveneSomaliSouth AfricanSouth AmericanSouth American IndianSoviet UnionSpaniardSpanishSpanish AmericanSpanish American IndianSri LankanSubsaharan AfricanSudaneseSwedishSwissSyrianTaiwaneseThaiTlingit-HaidaTohono O'OdhamTonganTrinidadian and TobagonianTsimshianTurkishU.S. Virgin IslanderUgandanUkrainianUruguayanUteVenezuelanVietnameseWelshWest IndianYakamaYaquiYugoslavianYumanYup'ikZimbabwean
Immigration
NonimmigrantsImmigrantsAfghanistanAfricaAlbaniaArgentinaArmeniaAsiaAustraliaAustriaBahamasBangladeshBarbadosBelarusBelgiumBelizeBosnia and HerzegovinaBrazilBulgariaBurma/MyanmarCabo VerdeCambodiaCameroonCanadaCaribbeanCentral AmericaChileChinaColombiaCongoCosta RicaCroatiaCubaCzechoslovakiaDenmarkDominicaDominican RepublicEastern AfricaEastern AsiaEastern EuropeEcuadorEgyptEl SalvadorEnglandEritreaEthiopiaEuropeFijiFranceGermanyGhanaGreeceGrenadaGuatemalaGuyanaHaitiHondurasHong KongHungaryIndiaIndonesiaIranIraqIrelandIsraelItalyJamaicaJapanJordanKazakhstanKenyaKoreaKuwaitLaosLatin AmericaLatviaLebanonLiberiaLithuaniaMalaysiaMexicoMicronesiaMiddle AfricaMoldovaMoroccoNepalNetherlandsNicaraguaNigeriaNorth AmericaNorth MacedoniaNorthern AfricaNorthern EuropeNorwayOceaniaPakistanPanamaPeruPhilippinesPolandPortugalRomaniaRussiaSaudi ArabiaScotlandSenegalSerbiaSierra LeoneSingaporeSomaliaSouth AfricaSouth AmericaSouth Central AsiaSouth Eastern AsiaSouthern EuropeSpainSri LankaSt. Vincent and the GrenadinesSudanSwedenSwitzerlandSyriaTaiwanThailandTrinidad and TobagoTurkeyUgandaUkraineUruguayUzbekistanVenezuelaVietnamWest IndiesWestern AfricaWestern AsiaWestern EuropeYemenZaireZimbabweAzores
Immigrants from Bolivia
Race
Ancestry
AfghanAfricanAlaska NativeAlaskan AthabascanAlbanianAleutAlsatianAmericanApacheArabArapahoArgentineanArmenianAssyrian/Chaldean/SyriacAustralianAustrianBahamianBangladeshiBarbadianBasqueBelgianBelizeanBermudanBhutaneseBlackfeetBolivianBrazilianBritishBritish West IndianBulgarianBurmeseCajunCambodianCanadianCape VerdeanCarpatho RusynCelticCentral AmericanCentral American IndianCherokeeCheyenneChickasawChileanChineseChippewaChoctawColombianColvilleComancheCosta RicanCreeCreekCroatianCrowCubanCypriotCzechCzechoslovakianDanishDelawareDominicanDutchDutch West IndianEastern EuropeanEcuadorianEgyptianEnglishEstonianEthiopianEuropeanFijianFilipinoFinnishFrenchFrench American IndianFrench CanadianGermanGerman RussianGhanaianGreekGuamanian/ChamorroGuatemalanGuyaneseHaitianHmongHonduranHopiHoumaHungarianIcelanderIndian (Asian)IndonesianInupiatIranianIraqiIrishIroquoisIsraeliItalianJamaicanJapaneseJordanianKenyanKiowaKoreanLaotianLatvianLebaneseLiberianLithuanianLumbeeLuxembourgerMacedonianMalaysianMalteseMarshalleseMenomineeMexicanMexican American IndianMongolianMoroccanNative HawaiianNavajoNepaleseNew ZealanderNicaraguanNigerianNorthern EuropeanNorwegianOkinawanOsageOttawaPaiutePakistaniPalestinianPanamanianParaguayanPennsylvania GermanPeruvianPimaPolishPortuguesePotawatomiPuebloPuerto RicanPuget Sound SalishRomanianRussianSalvadoranSamoanScandinavianScotch-IrishScottishSeminoleSenegaleseSerbianShoshoneSierra LeoneanSiouxSlavicSlovakSloveneSomaliSouth AfricanSouth AmericanSouth American IndianSoviet UnionSpaniardSpanishSpanish AmericanSpanish American IndianSri LankanSubsaharan AfricanSudaneseSwedishSwissSyrianTaiwaneseThaiTlingit-HaidaTohono O'OdhamTonganTrinidadian and TobagonianTsimshianTurkishU.S. Virgin IslanderUgandanUkrainianUruguayanUteVenezuelanVietnameseWelshWest IndianYakamaYaquiYugoslavianYumanYup'ikZimbabwean
Immigration
NonimmigrantsImmigrantsAfghanistanAfricaAlbaniaArgentinaArmeniaAsiaAustraliaAustriaBahamasBangladeshBarbadosBelarusBelgiumBelizeBoliviaBosnia and HerzegovinaBrazilBulgariaBurma/MyanmarCabo VerdeCambodiaCameroonCanadaCaribbeanCentral AmericaChileChinaColombiaCongoCosta RicaCroatiaCubaCzechoslovakiaDenmarkDominicaDominican RepublicEastern AfricaEastern AsiaEastern EuropeEcuadorEgyptEl SalvadorEnglandEritreaEthiopiaEuropeFijiFranceGermanyGhanaGreeceGrenadaGuatemalaGuyanaHaitiHondurasHong KongHungaryIndiaIndonesiaIranIraqIrelandIsraelItalyJamaicaJapanJordanKazakhstanKenyaKoreaKuwaitLaosLatin AmericaLatviaLebanonLiberiaLithuaniaMalaysiaMexicoMicronesiaMiddle AfricaMoldovaMoroccoNepalNetherlandsNicaraguaNigeriaNorth AmericaNorth MacedoniaNorthern AfricaNorthern EuropeNorwayOceaniaPakistanPanamaPeruPhilippinesPortugalRomaniaRussiaSaudi ArabiaScotlandSenegalSerbiaSierra LeoneSingaporeSomaliaSouth AfricaSouth AmericaSouth Central AsiaSouth Eastern AsiaSouthern EuropeSpainSri LankaSt. Vincent and the GrenadinesSudanSwedenSwitzerlandSyriaTaiwanThailandTrinidad and TobagoTurkeyUgandaUkraineUruguayUzbekistanVenezuelaVietnamWest IndiesWestern AfricaWestern AsiaWestern EuropeYemenZaireZimbabweAzores
7th Grade
Income
Poverty
Unemployment
Labor Participation
Family Structure
Vehicle Availability
Education Level
Disability

7th Grade Comparison

Immigrants from Poland

Immigrants from Bolivia

Average
Tragic
96.1%
7TH GRADE
59.0/ 100
METRIC RATING
168th/ 347
METRIC RANK
95.0%
7TH GRADE
0.1/ 100
METRIC RATING
282nd/ 347
METRIC RANK

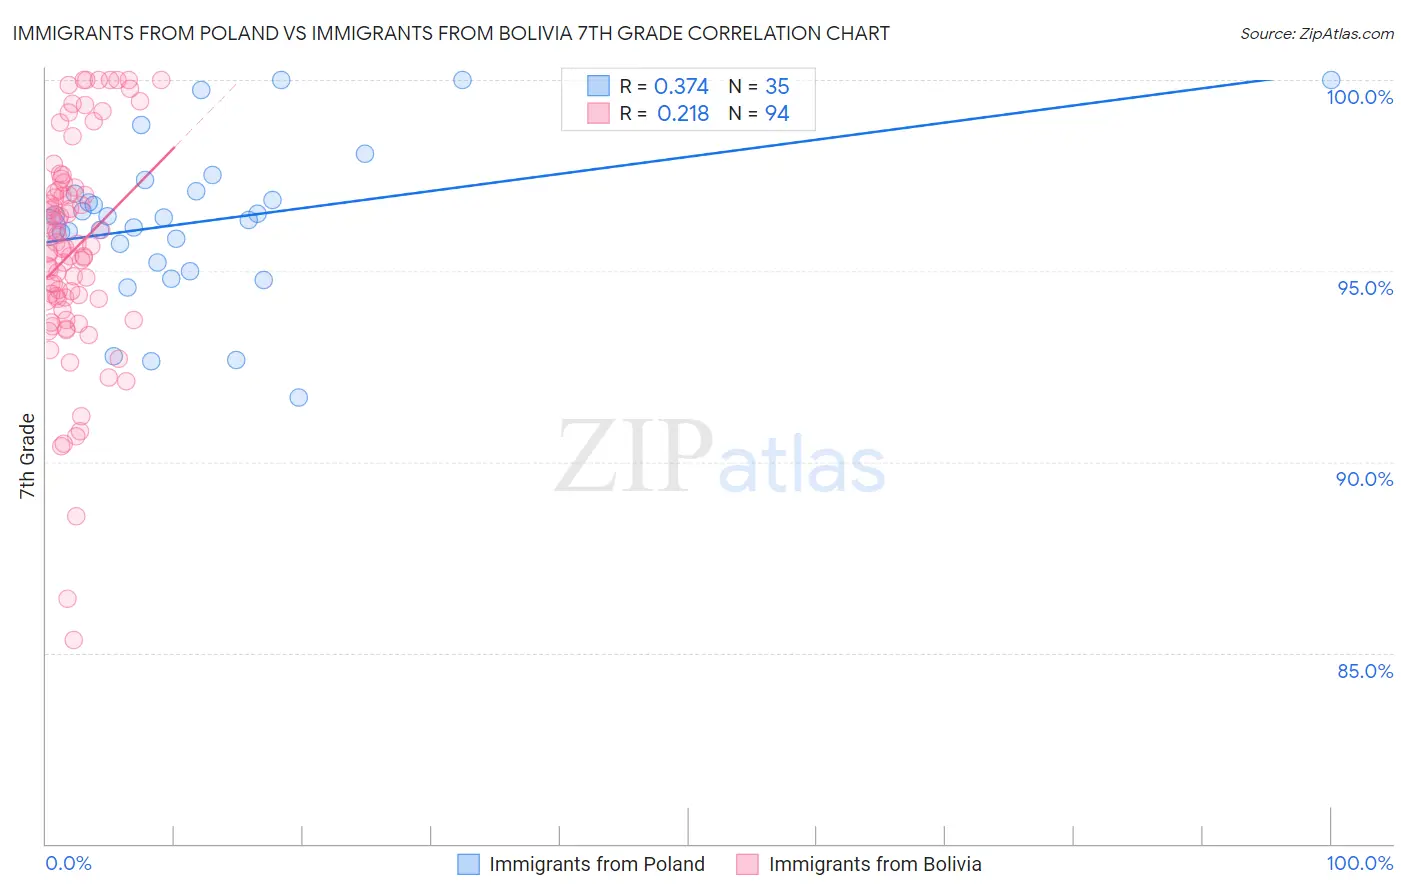
Immigrants from Poland vs Immigrants from Bolivia 7th Grade Correlation Chart

The statistical analysis conducted on geographies consisting of 304,861,877 people shows a mild positive correlation between the proportion of Immigrants from Poland and percentage of population with at least 7th grade education in the United States with a correlation coefficient (R) of 0.374 and weighted average of 96.1%. Similarly, the statistical analysis conducted on geographies consisting of 158,727,163 people shows a weak positive correlation between the proportion of Immigrants from Bolivia and percentage of population with at least 7th grade education in the United States with a correlation coefficient (R) of 0.218 and weighted average of 95.0%, a difference of 1.1%.
Immigrants from Poland vs Immigrants from Bolivia 7th Grade

7th Grade Correlation Summary

MeasurementImmigrants from PolandImmigrants from Bolivia
Minimum91.7%85.3%
Maximum100.0%100.0%
Range8.3%14.7%
Mean96.3%95.5%
Median96.4%95.6%
Interquartile 25% (IQ1)95.2%94.2%
Interquartile 75% (IQ3)97.1%97.1%
Interquartile Range (IQR)1.8%2.9%
Standard Deviation (Sample)2.0%2.9%
Standard Deviation (Population)2.0%2.9%

Similar Demographics by 7th Grade

Demographics Similar to Immigrants from Poland by 7th Grade

In terms of 7th grade, the demographic groups most similar to Immigrants from Poland are Immigrants from Kazakhstan (96.1%, a difference of 0.010%), Immigrants from Sri Lanka (96.1%, a difference of 0.010%), Spaniard (96.1%, a difference of 0.020%), Immigrants from Italy (96.1%, a difference of 0.020%), and Immigrants from Taiwan (96.1%, a difference of 0.020%).
DemographicsRating | Rank7th Grade
Bermudans
66.3
/100
|
#161
Good
96.1%
Pima
64.3
/100
|
#162
Good
96.1%
Spaniards
62.6
/100
|
#163
Good
96.1%
Immigrants | Italy
62.1
/100
|
#164
Good
96.1%
Immigrants | Taiwan
61.5
/100
|
#165
Good
96.1%
Immigrants | Kazakhstan
61.0
/100
|
#166
Good
96.1%
Immigrants | Sri Lanka
59.9
/100
|
#167
Average
96.1%
Immigrants | Poland
59.0
/100
|
#168
Average
96.1%
Ute
55.8
/100
|
#169
Average
96.1%
Immigrants | Ukraine
55.0
/100
|
#170
Average
96.1%
Egyptians
54.2
/100
|
#171
Average
96.1%
Venezuelans
51.4
/100
|
#172
Average
96.0%
Immigrants | Albania
50.4
/100
|
#173
Average
96.0%
Mongolians
50.0
/100
|
#174
Average
96.0%
Blacks/African Americans
49.5
/100
|
#175
Average
96.0%

Demographics Similar to Immigrants from Bolivia by 7th Grade

In terms of 7th grade, the demographic groups most similar to Immigrants from Bolivia are Immigrants from St. Vincent and the Grenadines (95.0%, a difference of 0.010%), Tohono O'odham (95.0%, a difference of 0.010%), Barbadian (95.1%, a difference of 0.040%), Immigrants from Trinidad and Tobago (95.1%, a difference of 0.050%), and Immigrants from Barbados (95.0%, a difference of 0.060%).
DemographicsRating | Rank7th Grade
Immigrants | Colombia
0.2
/100
|
#275
Tragic
95.1%
Immigrants | Thailand
0.2
/100
|
#276
Tragic
95.1%
Immigrants | Afghanistan
0.2
/100
|
#277
Tragic
95.1%
Immigrants | Trinidad and Tobago
0.1
/100
|
#278
Tragic
95.1%
Barbadians
0.1
/100
|
#279
Tragic
95.1%
Immigrants | St. Vincent and the Grenadines
0.1
/100
|
#280
Tragic
95.0%
Tohono O'odham
0.1
/100
|
#281
Tragic
95.0%
Immigrants | Bolivia
0.1
/100
|
#282
Tragic
95.0%
Immigrants | Barbados
0.1
/100
|
#283
Tragic
95.0%
Armenians
0.1
/100
|
#284
Tragic
95.0%
Immigrants | Eritrea
0.1
/100
|
#285
Tragic
94.9%
Immigrants | Philippines
0.0
/100
|
#286
Tragic
94.9%
Immigrants | Peru
0.0
/100
|
#287
Tragic
94.9%
British West Indians
0.0
/100
|
#288
Tragic
94.8%
Taiwanese
0.0
/100
|
#289
Tragic
94.8%