Immigrants from Philippines vs Delaware Doctorate Degree
COMPARE
Immigrants from Philippines
Delaware
Doctorate Degree
Doctorate Degree Comparison
Immigrants from Philippines
Delaware
1.6%
DOCTORATE DEGREE
4.3/ 100
METRIC RATING
230th/ 347
METRIC RANK
1.6%
DOCTORATE DEGREE
1.9/ 100
METRIC RATING
245th/ 347
METRIC RANK
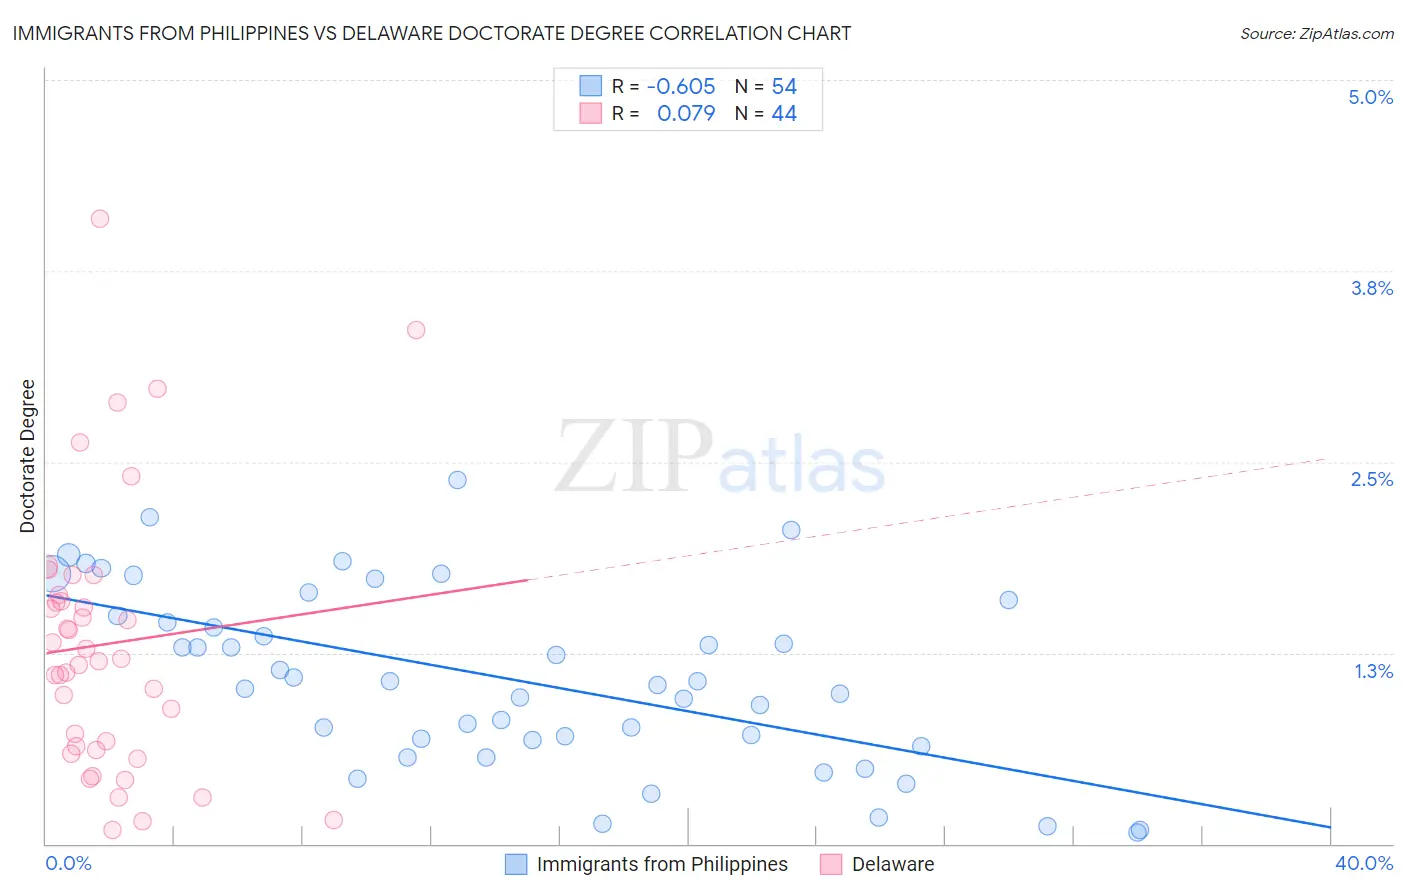
Immigrants from Philippines vs Delaware Doctorate Degree Correlation Chart
The statistical analysis conducted on geographies consisting of 464,152,098 people shows a significant negative correlation between the proportion of Immigrants from Philippines and percentage of population with at least doctorate degree education in the United States with a correlation coefficient (R) of -0.605 and weighted average of 1.6%. Similarly, the statistical analysis conducted on geographies consisting of 95,720,463 people shows a slight positive correlation between the proportion of Delaware and percentage of population with at least doctorate degree education in the United States with a correlation coefficient (R) of 0.079 and weighted average of 1.6%, a difference of 3.7%.
Doctorate Degree Correlation Summary
| Measurement | Immigrants from Philippines | Delaware |
| Minimum | 0.076% | 0.089% |
| Maximum | 2.4% | 4.1% |
| Range | 2.3% | 4.0% |
| Mean | 1.1% | 1.3% |
| Median | 1.0% | 1.2% |
| Interquartile 25% (IQ1) | 0.68% | 0.63% |
| Interquartile 75% (IQ3) | 1.5% | 1.6% |
| Interquartile Range (IQR) | 0.81% | 0.98% |
| Standard Deviation (Sample) | 0.58% | 0.88% |
| Standard Deviation (Population) | 0.57% | 0.87% |
Demographics Similar to Immigrants from Philippines and Delaware by Doctorate Degree
In terms of doctorate degree, the demographic groups most similar to Immigrants from Philippines are Colville (1.6%, a difference of 0.31%), Immigrants from North Macedonia (1.6%, a difference of 0.47%), Guamanian/Chamorro (1.6%, a difference of 1.2%), Barbadian (1.6%, a difference of 1.2%), and Assyrian/Chaldean/Syriac (1.7%, a difference of 1.3%). Similarly, the demographic groups most similar to Delaware are Hmong (1.6%, a difference of 0.10%), Comanche (1.6%, a difference of 0.12%), French American Indian (1.6%, a difference of 0.38%), Native Hawaiian (1.6%, a difference of 0.57%), and Ottawa (1.6%, a difference of 0.70%).
| Demographics | Rating | Rank | Doctorate Degree |
| Panamanians | 6.3 /100 | #227 | Tragic 1.7% |
| Assyrians/Chaldeans/Syriacs | 5.9 /100 | #228 | Tragic 1.7% |
| Colville | 4.7 /100 | #229 | Tragic 1.6% |
| Immigrants | Philippines | 4.3 /100 | #230 | Tragic 1.6% |
| Immigrants | North Macedonia | 3.9 /100 | #231 | Tragic 1.6% |
| Guamanians/Chamorros | 3.3 /100 | #232 | Tragic 1.6% |
| Barbadians | 3.3 /100 | #233 | Tragic 1.6% |
| Hopi | 3.2 /100 | #234 | Tragic 1.6% |
| Cree | 3.0 /100 | #235 | Tragic 1.6% |
| Indonesians | 2.8 /100 | #236 | Tragic 1.6% |
| Iroquois | 2.7 /100 | #237 | Tragic 1.6% |
| Immigrants | Congo | 2.6 /100 | #238 | Tragic 1.6% |
| West Indians | 2.5 /100 | #239 | Tragic 1.6% |
| Immigrants | Panama | 2.4 /100 | #240 | Tragic 1.6% |
| Cheyenne | 2.3 /100 | #241 | Tragic 1.6% |
| Ottawa | 2.2 /100 | #242 | Tragic 1.6% |
| Native Hawaiians | 2.1 /100 | #243 | Tragic 1.6% |
| French American Indians | 2.0 /100 | #244 | Tragic 1.6% |
| Delaware | 1.9 /100 | #245 | Tragic 1.6% |
| Hmong | 1.8 /100 | #246 | Tragic 1.6% |
| Comanche | 1.8 /100 | #247 | Tragic 1.6% |