Immigrants from Peru vs Immigrants from Syria Doctorate Degree
COMPARE
Immigrants from Peru
Immigrants from Syria
Doctorate Degree
Doctorate Degree Comparison
Immigrants from Peru
Immigrants from Syria
1.7%
DOCTORATE DEGREE
17.6/ 100
METRIC RATING
206th/ 347
METRIC RANK
1.9%
DOCTORATE DEGREE
83.6/ 100
METRIC RATING
146th/ 347
METRIC RANK
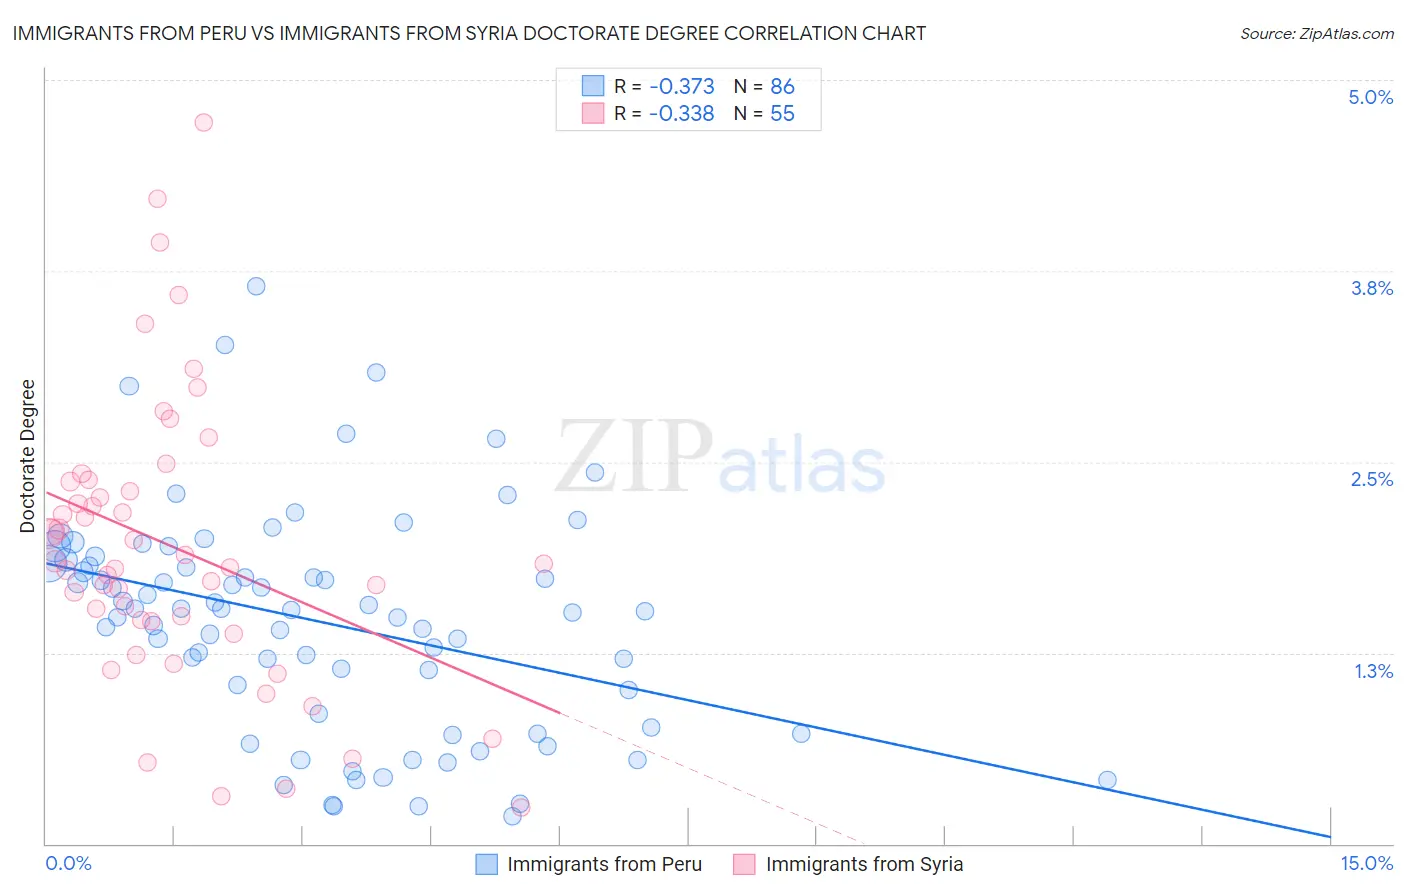
Immigrants from Peru vs Immigrants from Syria Doctorate Degree Correlation Chart
The statistical analysis conducted on geographies consisting of 327,090,544 people shows a mild negative correlation between the proportion of Immigrants from Peru and percentage of population with at least doctorate degree education in the United States with a correlation coefficient (R) of -0.373 and weighted average of 1.7%. Similarly, the statistical analysis conducted on geographies consisting of 173,800,904 people shows a mild negative correlation between the proportion of Immigrants from Syria and percentage of population with at least doctorate degree education in the United States with a correlation coefficient (R) of -0.338 and weighted average of 1.9%, a difference of 12.3%.
Doctorate Degree Correlation Summary
| Measurement | Immigrants from Peru | Immigrants from Syria |
| Minimum | 0.18% | 0.24% |
| Maximum | 3.6% | 4.7% |
| Range | 3.5% | 4.5% |
| Mean | 1.5% | 1.9% |
| Median | 1.5% | 1.8% |
| Interquartile 25% (IQ1) | 0.85% | 1.5% |
| Interquartile 75% (IQ3) | 1.8% | 2.4% |
| Interquartile Range (IQR) | 0.98% | 0.92% |
| Standard Deviation (Sample) | 0.73% | 0.94% |
| Standard Deviation (Population) | 0.72% | 0.93% |
Similar Demographics by Doctorate Degree
Demographics Similar to Immigrants from Peru by Doctorate Degree
In terms of doctorate degree, the demographic groups most similar to Immigrants from Peru are Yugoslavian (1.7%, a difference of 0.16%), Colombian (1.7%, a difference of 0.44%), Venezuelan (1.7%, a difference of 0.48%), Immigrants from Western Africa (1.7%, a difference of 0.63%), and Tongan (1.7%, a difference of 0.71%).
| Demographics | Rating | Rank | Doctorate Degree |
| Immigrants | South America | 23.3 /100 | #199 | Fair 1.8% |
| Whites/Caucasians | 22.8 /100 | #200 | Fair 1.8% |
| Immigrants | Nigeria | 22.4 /100 | #201 | Fair 1.8% |
| Portuguese | 21.4 /100 | #202 | Fair 1.8% |
| Immigrants | Vietnam | 21.4 /100 | #203 | Fair 1.8% |
| Somalis | 21.2 /100 | #204 | Fair 1.7% |
| Venezuelans | 19.5 /100 | #205 | Poor 1.7% |
| Immigrants | Peru | 17.6 /100 | #206 | Poor 1.7% |
| Yugoslavians | 17.1 /100 | #207 | Poor 1.7% |
| Colombians | 16.1 /100 | #208 | Poor 1.7% |
| Immigrants | Western Africa | 15.4 /100 | #209 | Poor 1.7% |
| Tongans | 15.1 /100 | #210 | Poor 1.7% |
| Immigrants | Armenia | 15.1 /100 | #211 | Poor 1.7% |
| Immigrants | South Eastern Asia | 14.7 /100 | #212 | Poor 1.7% |
| Koreans | 14.2 /100 | #213 | Poor 1.7% |
Demographics Similar to Immigrants from Syria by Doctorate Degree
In terms of doctorate degree, the demographic groups most similar to Immigrants from Syria are Kenyan (1.9%, a difference of 0.020%), Immigrants from Moldova (2.0%, a difference of 0.20%), Immigrants from Senegal (1.9%, a difference of 0.25%), Sierra Leonean (2.0%, a difference of 0.41%), and Luxembourger (1.9%, a difference of 0.58%).
| Demographics | Rating | Rank | Doctorate Degree |
| Afghans | 87.2 /100 | #139 | Excellent 2.0% |
| Immigrants | Africa | 87.0 /100 | #140 | Excellent 2.0% |
| Senegalese | 86.7 /100 | #141 | Excellent 2.0% |
| Italians | 86.0 /100 | #142 | Excellent 2.0% |
| Sierra Leoneans | 85.1 /100 | #143 | Excellent 2.0% |
| Immigrants | Moldova | 84.3 /100 | #144 | Excellent 2.0% |
| Kenyans | 83.6 /100 | #145 | Excellent 1.9% |
| Immigrants | Syria | 83.6 /100 | #146 | Excellent 1.9% |
| Immigrants | Senegal | 82.5 /100 | #147 | Excellent 1.9% |
| Luxembourgers | 81.1 /100 | #148 | Excellent 1.9% |
| Basques | 76.9 /100 | #149 | Good 1.9% |
| English | 75.9 /100 | #150 | Good 1.9% |
| Albanians | 74.8 /100 | #151 | Good 1.9% |
| Immigrants | Kenya | 74.3 /100 | #152 | Good 1.9% |
| Immigrants | Oceania | 74.0 /100 | #153 | Good 1.9% |