Immigrants from Panama vs Immigrants from Bangladesh Doctorate Degree
COMPARE
Immigrants from Panama
Immigrants from Bangladesh
Doctorate Degree
Doctorate Degree Comparison
Immigrants from Panama
Immigrants from Bangladesh
1.6%
DOCTORATE DEGREE
2.4/ 100
METRIC RATING
240th/ 347
METRIC RANK
1.8%
DOCTORATE DEGREE
50.0/ 100
METRIC RATING
174th/ 347
METRIC RANK
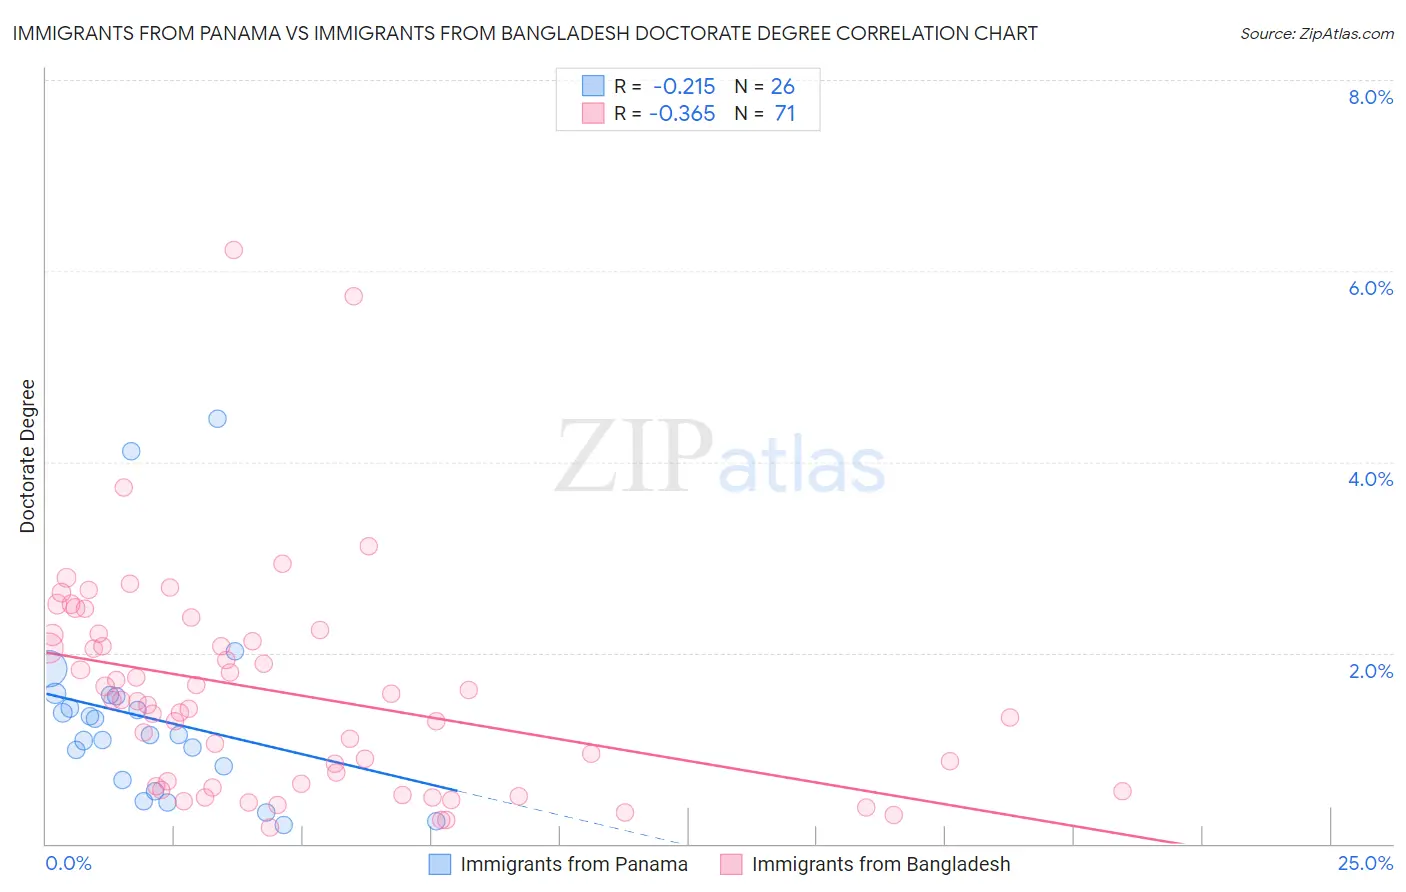
Immigrants from Panama vs Immigrants from Bangladesh Doctorate Degree Correlation Chart
The statistical analysis conducted on geographies consisting of 220,111,742 people shows a weak negative correlation between the proportion of Immigrants from Panama and percentage of population with at least doctorate degree education in the United States with a correlation coefficient (R) of -0.215 and weighted average of 1.6%. Similarly, the statistical analysis conducted on geographies consisting of 203,048,073 people shows a mild negative correlation between the proportion of Immigrants from Bangladesh and percentage of population with at least doctorate degree education in the United States with a correlation coefficient (R) of -0.365 and weighted average of 1.8%, a difference of 15.7%.
Doctorate Degree Correlation Summary
| Measurement | Immigrants from Panama | Immigrants from Bangladesh |
| Minimum | 0.20% | 0.17% |
| Maximum | 4.4% | 6.2% |
| Range | 4.2% | 6.0% |
| Mean | 1.3% | 1.6% |
| Median | 1.1% | 1.5% |
| Interquartile 25% (IQ1) | 0.67% | 0.60% |
| Interquartile 75% (IQ3) | 1.5% | 2.2% |
| Interquartile Range (IQR) | 0.88% | 1.6% |
| Standard Deviation (Sample) | 1.0% | 1.1% |
| Standard Deviation (Population) | 0.98% | 1.1% |
Similar Demographics by Doctorate Degree
Demographics Similar to Immigrants from Panama by Doctorate Degree
In terms of doctorate degree, the demographic groups most similar to Immigrants from Panama are West Indian (1.6%, a difference of 0.19%), Cheyenne (1.6%, a difference of 0.19%), Immigrants from Congo (1.6%, a difference of 0.29%), Ottawa (1.6%, a difference of 0.40%), and Iroquois (1.6%, a difference of 0.50%).
| Demographics | Rating | Rank | Doctorate Degree |
| Barbadians | 3.3 /100 | #233 | Tragic 1.6% |
| Hopi | 3.2 /100 | #234 | Tragic 1.6% |
| Cree | 3.0 /100 | #235 | Tragic 1.6% |
| Indonesians | 2.8 /100 | #236 | Tragic 1.6% |
| Iroquois | 2.7 /100 | #237 | Tragic 1.6% |
| Immigrants | Congo | 2.6 /100 | #238 | Tragic 1.6% |
| West Indians | 2.5 /100 | #239 | Tragic 1.6% |
| Immigrants | Panama | 2.4 /100 | #240 | Tragic 1.6% |
| Cheyenne | 2.3 /100 | #241 | Tragic 1.6% |
| Ottawa | 2.2 /100 | #242 | Tragic 1.6% |
| Native Hawaiians | 2.1 /100 | #243 | Tragic 1.6% |
| French American Indians | 2.0 /100 | #244 | Tragic 1.6% |
| Delaware | 1.9 /100 | #245 | Tragic 1.6% |
| Hmong | 1.8 /100 | #246 | Tragic 1.6% |
| Comanche | 1.8 /100 | #247 | Tragic 1.6% |
Demographics Similar to Immigrants from Bangladesh by Doctorate Degree
In terms of doctorate degree, the demographic groups most similar to Immigrants from Bangladesh are Norwegian (1.8%, a difference of 0.0%), Belgian (1.8%, a difference of 0.040%), Immigrants from Thailand (1.8%, a difference of 0.080%), Spanish (1.8%, a difference of 0.10%), and Iraqi (1.8%, a difference of 0.11%).
| Demographics | Rating | Rank | Doctorate Degree |
| Macedonians | 60.9 /100 | #167 | Good 1.9% |
| Sri Lankans | 60.3 /100 | #168 | Good 1.9% |
| Vietnamese | 54.8 /100 | #169 | Average 1.9% |
| Costa Ricans | 53.3 /100 | #170 | Average 1.8% |
| Bermudans | 52.1 /100 | #171 | Average 1.8% |
| Belgians | 50.3 /100 | #172 | Average 1.8% |
| Norwegians | 50.0 /100 | #173 | Average 1.8% |
| Immigrants | Bangladesh | 50.0 /100 | #174 | Average 1.8% |
| Immigrants | Thailand | 49.4 /100 | #175 | Average 1.8% |
| Spanish | 49.3 /100 | #176 | Average 1.8% |
| Iraqis | 49.2 /100 | #177 | Average 1.8% |
| French | 48.8 /100 | #178 | Average 1.8% |
| Ghanaians | 48.3 /100 | #179 | Average 1.8% |
| Scandinavians | 48.0 /100 | #180 | Average 1.8% |
| Immigrants | Immigrants | 46.2 /100 | #181 | Average 1.8% |