Immigrants from Pakistan vs Immigrants from Bangladesh 5th Grade
COMPARE
Immigrants from Pakistan
Immigrants from Bangladesh
5th Grade
5th Grade Comparison
Immigrants from Pakistan
Immigrants from Bangladesh
97.0%
5TH GRADE
4.7/ 100
METRIC RATING
227th/ 347
METRIC RANK
96.0%
5TH GRADE
0.0/ 100
METRIC RATING
311th/ 347
METRIC RANK
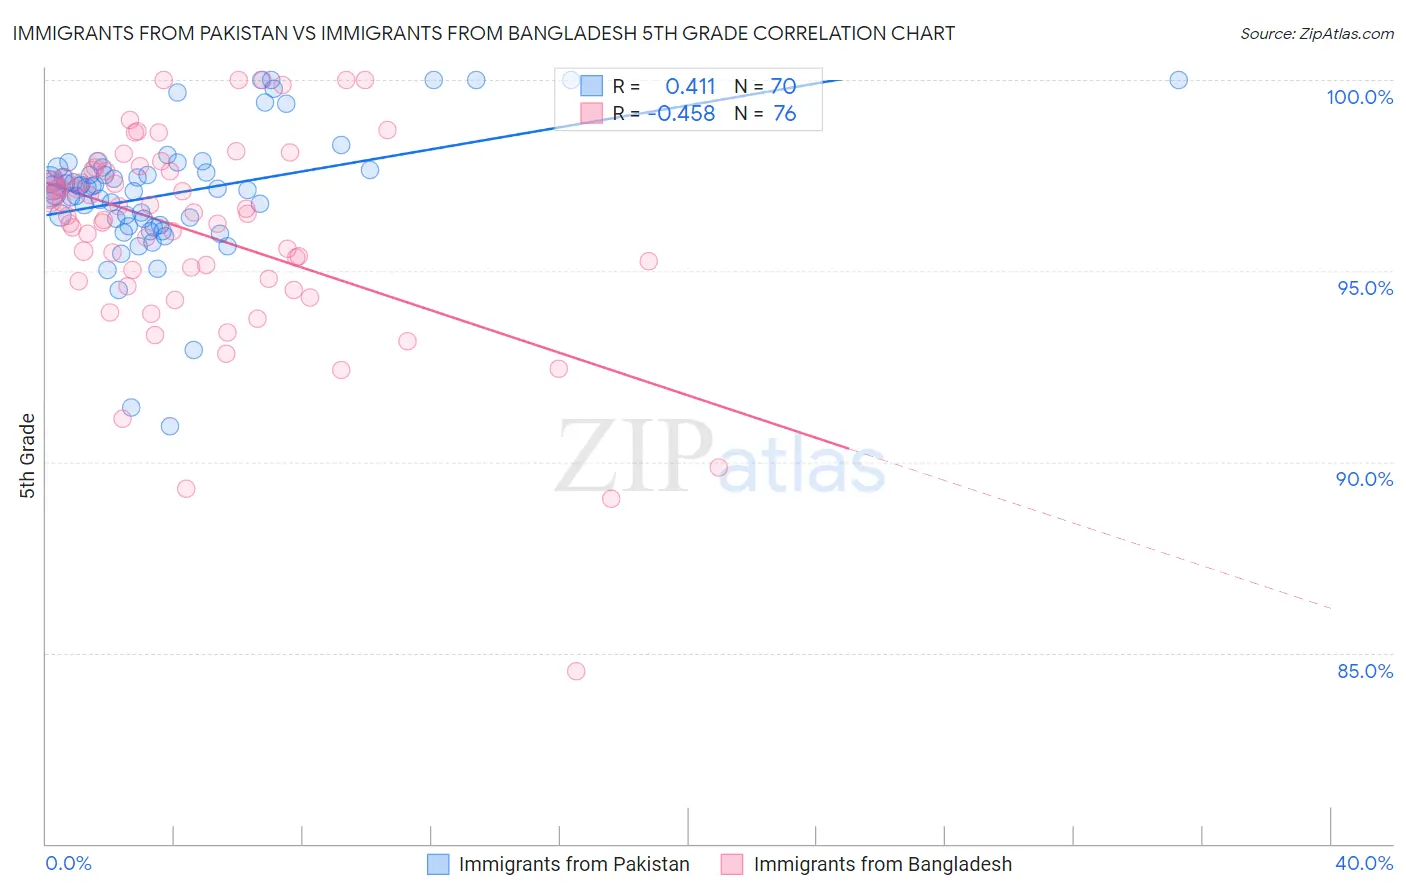
Immigrants from Pakistan vs Immigrants from Bangladesh 5th Grade Correlation Chart
The statistical analysis conducted on geographies consisting of 283,900,606 people shows a moderate positive correlation between the proportion of Immigrants from Pakistan and percentage of population with at least 5th grade education in the United States with a correlation coefficient (R) of 0.411 and weighted average of 97.0%. Similarly, the statistical analysis conducted on geographies consisting of 203,672,706 people shows a moderate negative correlation between the proportion of Immigrants from Bangladesh and percentage of population with at least 5th grade education in the United States with a correlation coefficient (R) of -0.458 and weighted average of 96.0%, a difference of 1.1%.
5th Grade Correlation Summary
| Measurement | Immigrants from Pakistan | Immigrants from Bangladesh |
| Minimum | 90.9% | 84.5% |
| Maximum | 100.0% | 100.0% |
| Range | 9.1% | 15.5% |
| Mean | 97.0% | 96.0% |
| Median | 97.2% | 96.5% |
| Interquartile 25% (IQ1) | 96.2% | 94.8% |
| Interquartile 75% (IQ3) | 97.7% | 97.6% |
| Interquartile Range (IQR) | 1.5% | 2.9% |
| Standard Deviation (Sample) | 1.7% | 2.7% |
| Standard Deviation (Population) | 1.7% | 2.7% |
Similar Demographics by 5th Grade
Demographics Similar to Immigrants from Pakistan by 5th Grade
In terms of 5th grade, the demographic groups most similar to Immigrants from Pakistan are Bahamian (97.0%, a difference of 0.010%), Tongan (97.0%, a difference of 0.010%), Assyrian/Chaldean/Syriac (97.0%, a difference of 0.010%), Yuman (97.0%, a difference of 0.010%), and Immigrants from Western Asia (97.0%, a difference of 0.010%).
| Demographics | Rating | Rank | 5th Grade |
| Immigrants | Southern Europe | 6.3 /100 | #220 | Tragic 97.1% |
| Sierra Leoneans | 6.0 /100 | #221 | Tragic 97.1% |
| Immigrants | Panama | 5.7 /100 | #222 | Tragic 97.0% |
| Liberians | 5.7 /100 | #223 | Tragic 97.0% |
| South American Indians | 5.4 /100 | #224 | Tragic 97.0% |
| Bahamians | 5.3 /100 | #225 | Tragic 97.0% |
| Tongans | 5.3 /100 | #226 | Tragic 97.0% |
| Immigrants | Pakistan | 4.7 /100 | #227 | Tragic 97.0% |
| Assyrians/Chaldeans/Syriacs | 4.5 /100 | #228 | Tragic 97.0% |
| Yuman | 4.5 /100 | #229 | Tragic 97.0% |
| Immigrants | Western Asia | 4.3 /100 | #230 | Tragic 97.0% |
| Immigrants | Malaysia | 4.1 /100 | #231 | Tragic 97.0% |
| Immigrants | Eastern Asia | 4.0 /100 | #232 | Tragic 97.0% |
| Sub-Saharan Africans | 3.3 /100 | #233 | Tragic 97.0% |
| Tohono O'odham | 3.2 /100 | #234 | Tragic 97.0% |
Demographics Similar to Immigrants from Bangladesh by 5th Grade
In terms of 5th grade, the demographic groups most similar to Immigrants from Bangladesh are Indonesian (96.0%, a difference of 0.020%), Vietnamese (95.9%, a difference of 0.030%), Bangladeshi (95.9%, a difference of 0.050%), Immigrants from Portugal (95.9%, a difference of 0.050%), and Ecuadorian (96.0%, a difference of 0.070%).
| Demographics | Rating | Rank | 5th Grade |
| Immigrants | Burma/Myanmar | 0.0 /100 | #304 | Tragic 96.1% |
| Immigrants | Laos | 0.0 /100 | #305 | Tragic 96.0% |
| Immigrants | Haiti | 0.0 /100 | #306 | Tragic 96.0% |
| Immigrants | Caribbean | 0.0 /100 | #307 | Tragic 96.0% |
| Ecuadorians | 0.0 /100 | #308 | Tragic 96.0% |
| Immigrants | Guyana | 0.0 /100 | #309 | Tragic 96.0% |
| Indonesians | 0.0 /100 | #310 | Tragic 96.0% |
| Immigrants | Bangladesh | 0.0 /100 | #311 | Tragic 96.0% |
| Vietnamese | 0.0 /100 | #312 | Tragic 95.9% |
| Bangladeshis | 0.0 /100 | #313 | Tragic 95.9% |
| Immigrants | Portugal | 0.0 /100 | #314 | Tragic 95.9% |
| Nicaraguans | 0.0 /100 | #315 | Tragic 95.9% |
| Immigrants | Ecuador | 0.0 /100 | #316 | Tragic 95.8% |
| Belizeans | 0.0 /100 | #317 | Tragic 95.8% |
| Immigrants | Vietnam | 0.0 /100 | #318 | Tragic 95.8% |