Immigrants from Pakistan vs Bangladeshi 4th Grade
COMPARE
Immigrants from Pakistan
Bangladeshi
4th Grade
4th Grade Comparison
Immigrants from Pakistan
Bangladeshis
97.2%
4TH GRADE
3.7/ 100
METRIC RATING
227th/ 347
METRIC RANK
96.1%
4TH GRADE
0.0/ 100
METRIC RATING
320th/ 347
METRIC RANK
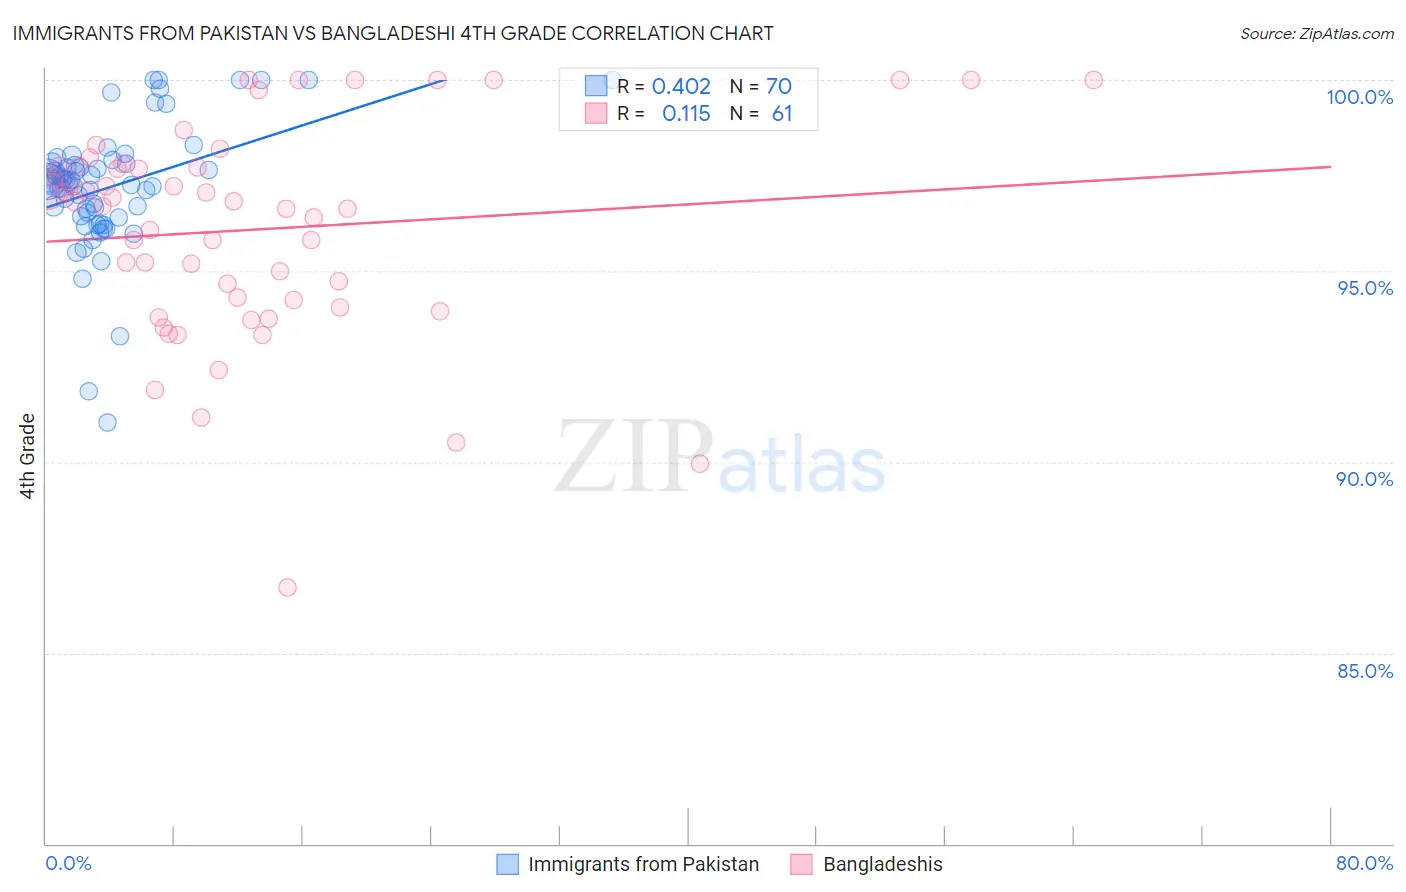
Immigrants from Pakistan vs Bangladeshi 4th Grade Correlation Chart
The statistical analysis conducted on geographies consisting of 283,900,606 people shows a moderate positive correlation between the proportion of Immigrants from Pakistan and percentage of population with at least 4th grade education in the United States with a correlation coefficient (R) of 0.402 and weighted average of 97.2%. Similarly, the statistical analysis conducted on geographies consisting of 141,430,495 people shows a poor positive correlation between the proportion of Bangladeshis and percentage of population with at least 4th grade education in the United States with a correlation coefficient (R) of 0.115 and weighted average of 96.1%, a difference of 1.2%.
4th Grade Correlation Summary
| Measurement | Immigrants from Pakistan | Bangladeshi |
| Minimum | 91.0% | 86.7% |
| Maximum | 100.0% | 100.0% |
| Range | 9.0% | 13.3% |
| Mean | 97.2% | 96.1% |
| Median | 97.3% | 96.7% |
| Interquartile 25% (IQ1) | 96.4% | 94.1% |
| Interquartile 75% (IQ3) | 97.8% | 97.7% |
| Interquartile Range (IQR) | 1.4% | 3.6% |
| Standard Deviation (Sample) | 1.7% | 2.8% |
| Standard Deviation (Population) | 1.6% | 2.8% |
Similar Demographics by 4th Grade
Demographics Similar to Immigrants from Pakistan by 4th Grade
In terms of 4th grade, the demographic groups most similar to Immigrants from Pakistan are Bahamian (97.2%, a difference of 0.0%), Subsaharan African (97.2%, a difference of 0.0%), Liberian (97.2%, a difference of 0.0%), Uruguayan (97.2%, a difference of 0.010%), and Immigrants from Malaysia (97.2%, a difference of 0.010%).
| Demographics | Rating | Rank | 4th Grade |
| South American Indians | 5.5 /100 | #220 | Tragic 97.3% |
| Immigrants | Panama | 5.4 /100 | #221 | Tragic 97.3% |
| Immigrants | Lebanon | 5.1 /100 | #222 | Tragic 97.3% |
| Immigrants | Sudan | 5.0 /100 | #223 | Tragic 97.2% |
| Immigrants | Syria | 5.0 /100 | #224 | Tragic 97.2% |
| Immigrants | Iraq | 4.6 /100 | #225 | Tragic 97.2% |
| Bahamians | 3.8 /100 | #226 | Tragic 97.2% |
| Immigrants | Pakistan | 3.7 /100 | #227 | Tragic 97.2% |
| Sub-Saharan Africans | 3.6 /100 | #228 | Tragic 97.2% |
| Liberians | 3.6 /100 | #229 | Tragic 97.2% |
| Uruguayans | 3.5 /100 | #230 | Tragic 97.2% |
| Immigrants | Malaysia | 3.4 /100 | #231 | Tragic 97.2% |
| Immigrants | Western Asia | 3.4 /100 | #232 | Tragic 97.2% |
| Senegalese | 3.1 /100 | #233 | Tragic 97.2% |
| Assyrians/Chaldeans/Syriacs | 3.0 /100 | #234 | Tragic 97.2% |
Demographics Similar to Bangladeshis by 4th Grade
In terms of 4th grade, the demographic groups most similar to Bangladeshis are Belizean (96.1%, a difference of 0.010%), Immigrants from the Azores (96.1%, a difference of 0.040%), Central American Indian (96.2%, a difference of 0.070%), Japanese (96.0%, a difference of 0.080%), and Immigrants from Vietnam (96.0%, a difference of 0.090%).
| Demographics | Rating | Rank | 4th Grade |
| Indonesians | 0.0 /100 | #313 | Tragic 96.2% |
| Vietnamese | 0.0 /100 | #314 | Tragic 96.2% |
| Nicaraguans | 0.0 /100 | #315 | Tragic 96.2% |
| Immigrants | Ecuador | 0.0 /100 | #316 | Tragic 96.2% |
| Central American Indians | 0.0 /100 | #317 | Tragic 96.2% |
| Immigrants | Azores | 0.0 /100 | #318 | Tragic 96.1% |
| Belizeans | 0.0 /100 | #319 | Tragic 96.1% |
| Bangladeshis | 0.0 /100 | #320 | Tragic 96.1% |
| Japanese | 0.0 /100 | #321 | Tragic 96.0% |
| Immigrants | Vietnam | 0.0 /100 | #322 | Tragic 96.0% |
| Immigrants | Nicaragua | 0.0 /100 | #323 | Tragic 96.0% |
| Immigrants | Belize | 0.0 /100 | #324 | Tragic 96.0% |
| Dominicans | 0.0 /100 | #325 | Tragic 96.0% |
| Hispanics or Latinos | 0.0 /100 | #326 | Tragic 96.0% |
| Hondurans | 0.0 /100 | #327 | Tragic 96.0% |