Immigrants from Oceania vs Armenian 4th Grade
COMPARE
Immigrants from Oceania
Armenian
4th Grade
4th Grade Comparison
Immigrants from Oceania
Armenians
97.3%
4TH GRADE
9.1/ 100
METRIC RATING
210th/ 347
METRIC RANK
97.0%
4TH GRADE
0.3/ 100
METRIC RATING
265th/ 347
METRIC RANK
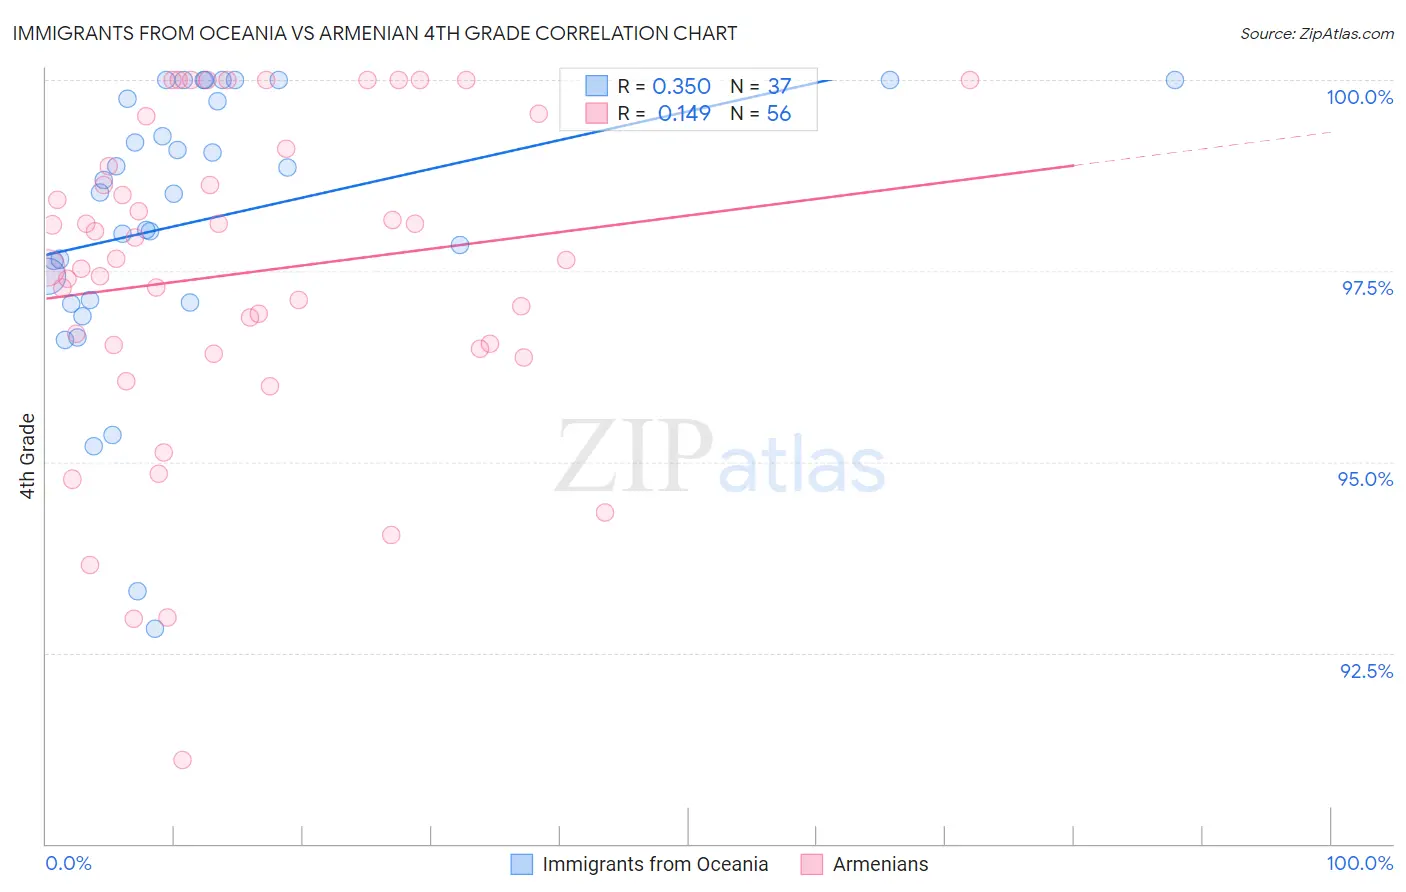
Immigrants from Oceania vs Armenian 4th Grade Correlation Chart
The statistical analysis conducted on geographies consisting of 305,521,521 people shows a mild positive correlation between the proportion of Immigrants from Oceania and percentage of population with at least 4th grade education in the United States with a correlation coefficient (R) of 0.350 and weighted average of 97.3%. Similarly, the statistical analysis conducted on geographies consisting of 310,954,660 people shows a poor positive correlation between the proportion of Armenians and percentage of population with at least 4th grade education in the United States with a correlation coefficient (R) of 0.149 and weighted average of 97.0%, a difference of 0.33%.
4th Grade Correlation Summary
| Measurement | Immigrants from Oceania | Armenian |
| Minimum | 92.8% | 91.1% |
| Maximum | 100.0% | 100.0% |
| Range | 7.2% | 8.9% |
| Mean | 98.2% | 97.5% |
| Median | 98.5% | 97.6% |
| Interquartile 25% (IQ1) | 97.1% | 96.5% |
| Interquartile 75% (IQ3) | 99.9% | 99.0% |
| Interquartile Range (IQR) | 2.8% | 2.5% |
| Standard Deviation (Sample) | 1.8% | 2.1% |
| Standard Deviation (Population) | 1.8% | 2.1% |
Similar Demographics by 4th Grade
Demographics Similar to Immigrants from Oceania by 4th Grade
In terms of 4th grade, the demographic groups most similar to Immigrants from Oceania are Laotian (97.3%, a difference of 0.0%), Sudanese (97.3%, a difference of 0.0%), Tohono O'odham (97.3%, a difference of 0.010%), Costa Rican (97.3%, a difference of 0.010%), and Moroccan (97.3%, a difference of 0.020%).
| Demographics | Rating | Rank | 4th Grade |
| Immigrants | Northern Africa | 15.1 /100 | #203 | Poor 97.4% |
| Africans | 14.6 /100 | #204 | Poor 97.4% |
| Paiute | 13.2 /100 | #205 | Poor 97.3% |
| Immigrants | Zaire | 12.8 /100 | #206 | Poor 97.3% |
| Moroccans | 11.3 /100 | #207 | Poor 97.3% |
| Immigrants | Bahamas | 10.8 /100 | #208 | Poor 97.3% |
| Laotians | 9.3 /100 | #209 | Tragic 97.3% |
| Immigrants | Oceania | 9.1 /100 | #210 | Tragic 97.3% |
| Sudanese | 9.0 /100 | #211 | Tragic 97.3% |
| Tohono O'odham | 8.4 /100 | #212 | Tragic 97.3% |
| Costa Ricans | 8.3 /100 | #213 | Tragic 97.3% |
| Immigrants | Nepal | 7.7 /100 | #214 | Tragic 97.3% |
| Immigrants | Morocco | 7.1 /100 | #215 | Tragic 97.3% |
| Samoans | 6.8 /100 | #216 | Tragic 97.3% |
| Sierra Leoneans | 6.5 /100 | #217 | Tragic 97.3% |
Demographics Similar to Armenians by 4th Grade
In terms of 4th grade, the demographic groups most similar to Armenians are Taiwanese (97.0%, a difference of 0.0%), Immigrants from China (97.0%, a difference of 0.010%), Immigrants from Nigeria (97.0%, a difference of 0.010%), Immigrants from South America (97.0%, a difference of 0.020%), and West Indian (97.0%, a difference of 0.020%).
| Demographics | Rating | Rank | 4th Grade |
| Immigrants | Colombia | 0.5 /100 | #258 | Tragic 97.0% |
| Immigrants | Ethiopia | 0.4 /100 | #259 | Tragic 97.0% |
| Immigrants | Sierra Leone | 0.4 /100 | #260 | Tragic 97.0% |
| Immigrants | South America | 0.4 /100 | #261 | Tragic 97.0% |
| West Indians | 0.4 /100 | #262 | Tragic 97.0% |
| Immigrants | Jamaica | 0.3 /100 | #263 | Tragic 97.0% |
| Taiwanese | 0.3 /100 | #264 | Tragic 97.0% |
| Armenians | 0.3 /100 | #265 | Tragic 97.0% |
| Immigrants | China | 0.3 /100 | #266 | Tragic 97.0% |
| Immigrants | Nigeria | 0.3 /100 | #267 | Tragic 97.0% |
| Ghanaians | 0.2 /100 | #268 | Tragic 97.0% |
| Immigrants | Uzbekistan | 0.2 /100 | #269 | Tragic 96.9% |
| Cubans | 0.2 /100 | #270 | Tragic 96.9% |
| Immigrants | Peru | 0.1 /100 | #271 | Tragic 96.9% |
| Fijians | 0.1 /100 | #272 | Tragic 96.9% |