Immigrants from Norway vs Hawaiian 4th Grade
COMPARE
Immigrants from Norway
Hawaiian
4th Grade
4th Grade Comparison
Immigrants from Norway
Hawaiians
97.8%
4TH GRADE
94.2/ 100
METRIC RATING
121st/ 347
METRIC RANK
97.4%
4TH GRADE
25.6/ 100
METRIC RATING
197th/ 347
METRIC RANK
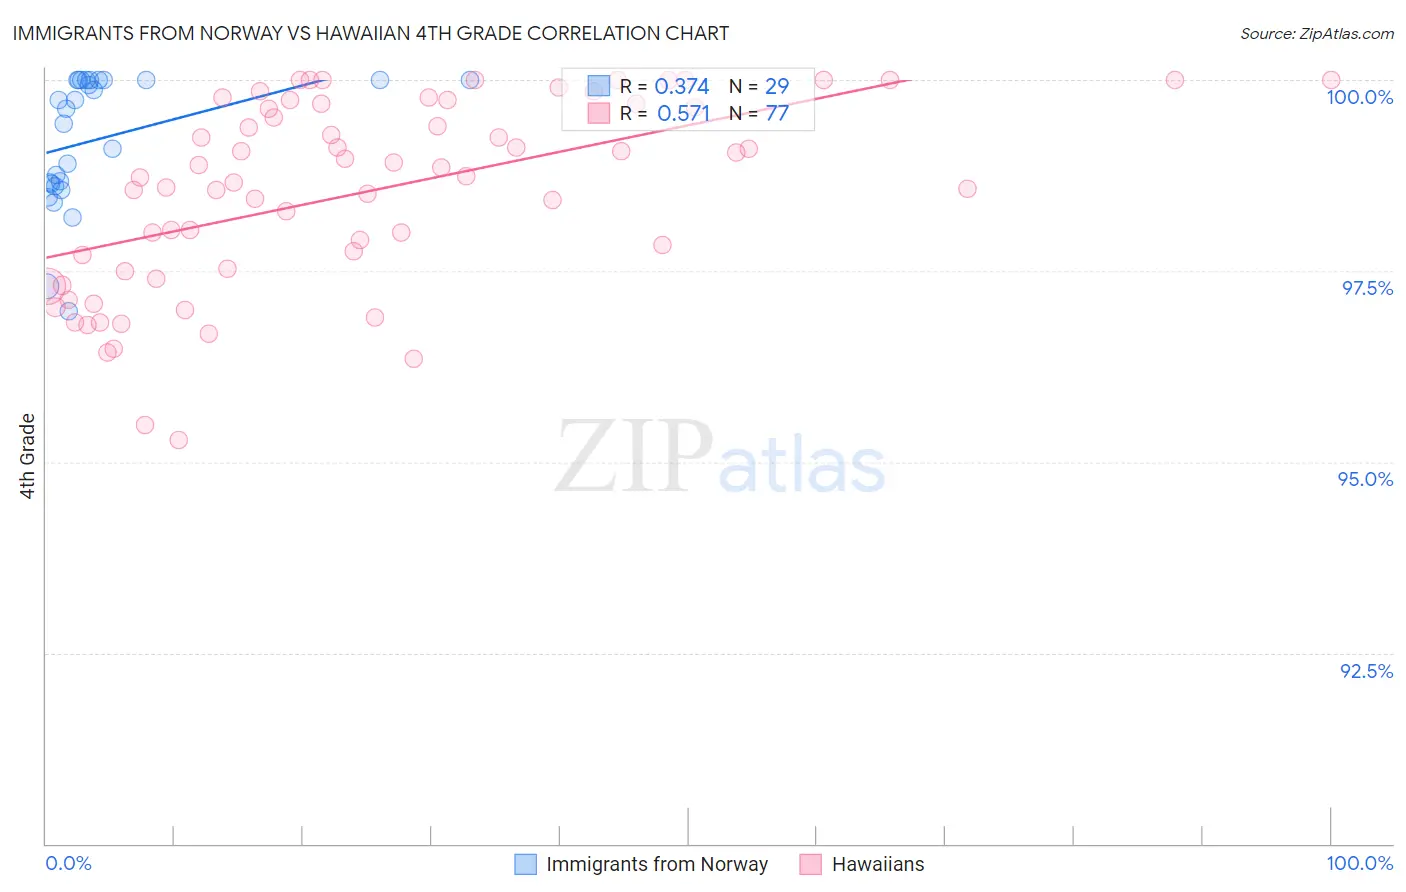
Immigrants from Norway vs Hawaiian 4th Grade Correlation Chart
The statistical analysis conducted on geographies consisting of 116,716,420 people shows a mild positive correlation between the proportion of Immigrants from Norway and percentage of population with at least 4th grade education in the United States with a correlation coefficient (R) of 0.374 and weighted average of 97.8%. Similarly, the statistical analysis conducted on geographies consisting of 327,621,279 people shows a substantial positive correlation between the proportion of Hawaiians and percentage of population with at least 4th grade education in the United States with a correlation coefficient (R) of 0.571 and weighted average of 97.4%, a difference of 0.36%.
4th Grade Correlation Summary
| Measurement | Immigrants from Norway | Hawaiian |
| Minimum | 97.0% | 95.3% |
| Maximum | 100.0% | 100.0% |
| Range | 3.0% | 4.7% |
| Mean | 99.2% | 98.5% |
| Median | 99.6% | 98.7% |
| Interquartile 25% (IQ1) | 98.6% | 97.5% |
| Interquartile 75% (IQ3) | 100.0% | 99.7% |
| Interquartile Range (IQR) | 1.4% | 2.2% |
| Standard Deviation (Sample) | 0.86% | 1.2% |
| Standard Deviation (Population) | 0.85% | 1.2% |
Similar Demographics by 4th Grade
Demographics Similar to Immigrants from Norway by 4th Grade
In terms of 4th grade, the demographic groups most similar to Immigrants from Norway are Immigrants from Japan (97.8%, a difference of 0.0%), Immigrants from Zimbabwe (97.8%, a difference of 0.0%), Syrian (97.8%, a difference of 0.010%), Menominee (97.8%, a difference of 0.010%), and Immigrants from Saudi Arabia (97.8%, a difference of 0.010%).
| Demographics | Rating | Rank | 4th Grade |
| Iroquois | 95.4 /100 | #114 | Exceptional 97.8% |
| Lebanese | 95.4 /100 | #115 | Exceptional 97.8% |
| Immigrants | Croatia | 95.2 /100 | #116 | Exceptional 97.8% |
| Syrians | 94.9 /100 | #117 | Exceptional 97.8% |
| Menominee | 94.9 /100 | #118 | Exceptional 97.8% |
| Immigrants | Saudi Arabia | 94.8 /100 | #119 | Exceptional 97.8% |
| Immigrants | France | 94.8 /100 | #120 | Exceptional 97.8% |
| Immigrants | Norway | 94.2 /100 | #121 | Exceptional 97.8% |
| Immigrants | Japan | 94.1 /100 | #122 | Exceptional 97.8% |
| Immigrants | Zimbabwe | 93.9 /100 | #123 | Exceptional 97.8% |
| Spanish | 93.7 /100 | #124 | Exceptional 97.8% |
| Immigrants | Serbia | 92.6 /100 | #125 | Exceptional 97.8% |
| Immigrants | Europe | 92.5 /100 | #126 | Exceptional 97.8% |
| Colville | 92.3 /100 | #127 | Exceptional 97.7% |
| Pima | 92.0 /100 | #128 | Exceptional 97.7% |
Demographics Similar to Hawaiians by 4th Grade
In terms of 4th grade, the demographic groups most similar to Hawaiians are Immigrants from Albania (97.4%, a difference of 0.010%), Guamanian/Chamorro (97.4%, a difference of 0.010%), Navajo (97.4%, a difference of 0.020%), Immigrants from Ukraine (97.4%, a difference of 0.020%), and Immigrants from Egypt (97.4%, a difference of 0.020%).
| Demographics | Rating | Rank | 4th Grade |
| Blacks/African Americans | 31.1 /100 | #190 | Fair 97.4% |
| Navajo | 30.7 /100 | #191 | Fair 97.4% |
| Immigrants | Ukraine | 30.1 /100 | #192 | Fair 97.4% |
| Immigrants | Egypt | 30.1 /100 | #193 | Fair 97.4% |
| Portuguese | 29.2 /100 | #194 | Fair 97.4% |
| Paraguayans | 28.9 /100 | #195 | Fair 97.4% |
| Immigrants | Albania | 27.7 /100 | #196 | Fair 97.4% |
| Hawaiians | 25.6 /100 | #197 | Fair 97.4% |
| Guamanians/Chamorros | 23.0 /100 | #198 | Fair 97.4% |
| Natives/Alaskans | 20.6 /100 | #199 | Fair 97.4% |
| Immigrants | Uganda | 19.8 /100 | #200 | Poor 97.4% |
| Immigrants | Southern Europe | 16.2 /100 | #201 | Poor 97.4% |
| Immigrants | Chile | 16.1 /100 | #202 | Poor 97.4% |
| Immigrants | Northern Africa | 15.1 /100 | #203 | Poor 97.4% |
| Africans | 14.6 /100 | #204 | Poor 97.4% |