Immigrants from Norway vs English 2nd Grade
COMPARE
Immigrants from Norway
English
2nd Grade
2nd Grade Comparison
Immigrants from Norway
English
98.1%
2ND GRADE
96.5/ 100
METRIC RATING
113th/ 347
METRIC RANK
98.6%
2ND GRADE
100.0/ 100
METRIC RATING
13th/ 347
METRIC RANK
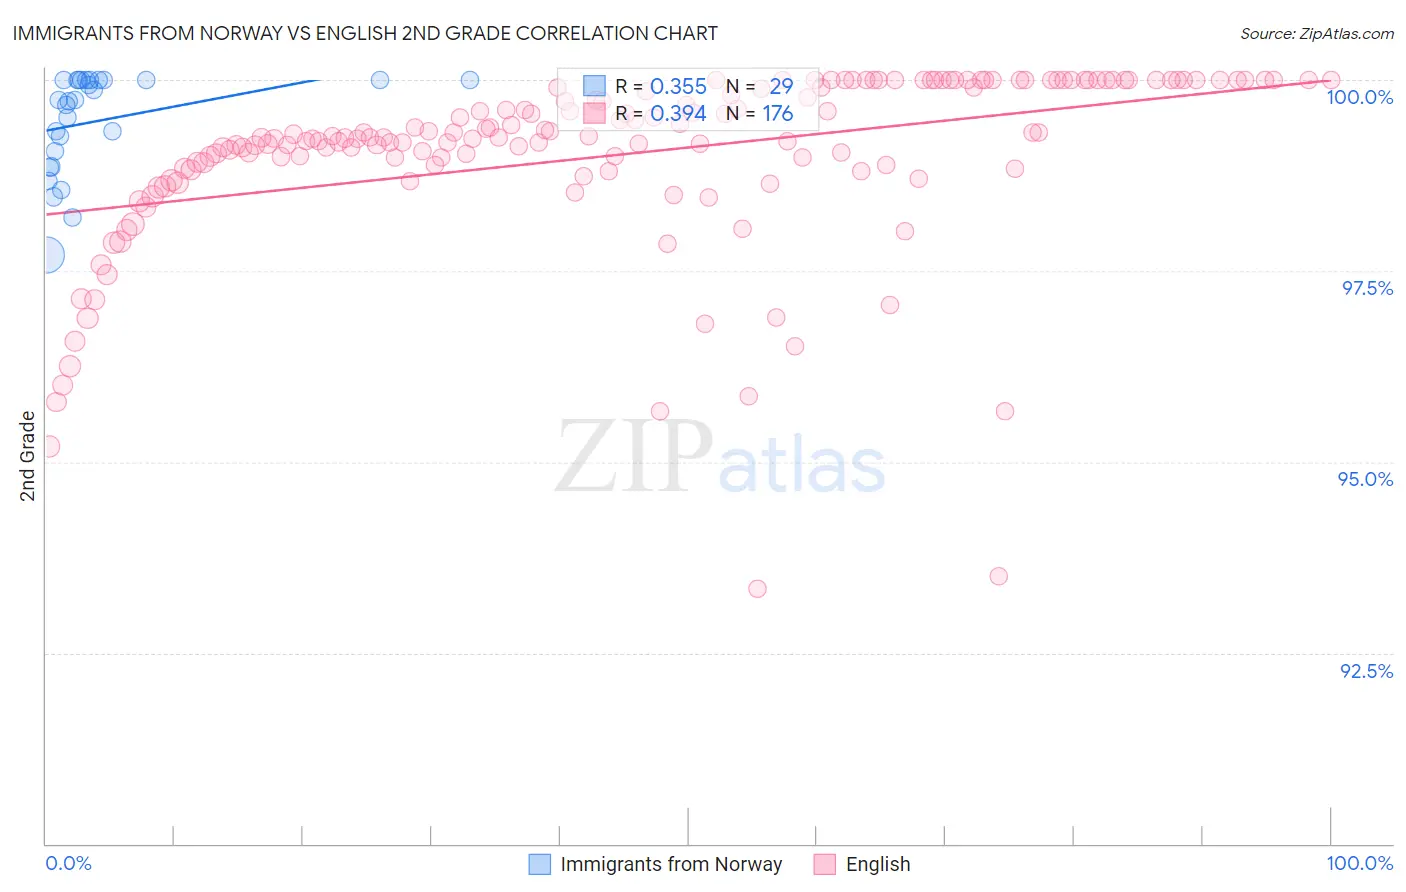
Immigrants from Norway vs English 2nd Grade Correlation Chart
The statistical analysis conducted on geographies consisting of 116,716,420 people shows a mild positive correlation between the proportion of Immigrants from Norway and percentage of population with at least 2nd grade education in the United States with a correlation coefficient (R) of 0.355 and weighted average of 98.1%. Similarly, the statistical analysis conducted on geographies consisting of 579,981,412 people shows a mild positive correlation between the proportion of English and percentage of population with at least 2nd grade education in the United States with a correlation coefficient (R) of 0.394 and weighted average of 98.6%, a difference of 0.50%.
2nd Grade Correlation Summary
| Measurement | Immigrants from Norway | English |
| Minimum | 97.7% | 93.3% |
| Maximum | 100.0% | 100.0% |
| Range | 2.3% | 6.7% |
| Mean | 99.5% | 99.0% |
| Median | 99.7% | 99.2% |
| Interquartile 25% (IQ1) | 99.0% | 98.8% |
| Interquartile 75% (IQ3) | 100.0% | 100.0% |
| Interquartile Range (IQR) | 1.0% | 1.2% |
| Standard Deviation (Sample) | 0.65% | 1.2% |
| Standard Deviation (Population) | 0.64% | 1.2% |
Similar Demographics by 2nd Grade
Demographics Similar to Immigrants from Norway by 2nd Grade
In terms of 2nd grade, the demographic groups most similar to Immigrants from Norway are Colville (98.1%, a difference of 0.0%), Immigrants from Latvia (98.1%, a difference of 0.0%), Immigrants from Singapore (98.1%, a difference of 0.010%), Immigrants from Czechoslovakia (98.1%, a difference of 0.010%), and Iranian (98.1%, a difference of 0.010%).
| Demographics | Rating | Rank | 2nd Grade |
| Bhutanese | 97.5 /100 | #106 | Exceptional 98.1% |
| German Russians | 97.4 /100 | #107 | Exceptional 98.1% |
| Immigrants | Switzerland | 97.3 /100 | #108 | Exceptional 98.1% |
| Basques | 97.2 /100 | #109 | Exceptional 98.1% |
| Immigrants | Singapore | 97.0 /100 | #110 | Exceptional 98.1% |
| Immigrants | Czechoslovakia | 96.9 /100 | #111 | Exceptional 98.1% |
| Colville | 96.6 /100 | #112 | Exceptional 98.1% |
| Immigrants | Norway | 96.5 /100 | #113 | Exceptional 98.1% |
| Immigrants | Latvia | 96.4 /100 | #114 | Exceptional 98.1% |
| Iranians | 95.9 /100 | #115 | Exceptional 98.1% |
| Spanish | 95.8 /100 | #116 | Exceptional 98.1% |
| Ute | 95.7 /100 | #117 | Exceptional 98.1% |
| Immigrants | France | 95.6 /100 | #118 | Exceptional 98.1% |
| Thais | 95.3 /100 | #119 | Exceptional 98.1% |
| Okinawans | 94.9 /100 | #120 | Exceptional 98.1% |
Demographics Similar to English by 2nd Grade
In terms of 2nd grade, the demographic groups most similar to English are Carpatho Rusyn (98.6%, a difference of 0.0%), Slovene (98.6%, a difference of 0.010%), Tlingit-Haida (98.6%, a difference of 0.010%), Swedish (98.6%, a difference of 0.010%), and Scottish (98.6%, a difference of 0.030%).
| Demographics | Rating | Rank | 2nd Grade |
| Alaska Natives | 100.0 /100 | #6 | Exceptional 98.7% |
| Norwegians | 100.0 /100 | #7 | Exceptional 98.7% |
| Germans | 100.0 /100 | #8 | Exceptional 98.7% |
| Slovaks | 100.0 /100 | #9 | Exceptional 98.7% |
| Slovenes | 100.0 /100 | #10 | Exceptional 98.6% |
| Tlingit-Haida | 100.0 /100 | #11 | Exceptional 98.6% |
| Carpatho Rusyns | 100.0 /100 | #12 | Exceptional 98.6% |
| English | 100.0 /100 | #13 | Exceptional 98.6% |
| Swedes | 100.0 /100 | #14 | Exceptional 98.6% |
| Scottish | 100.0 /100 | #15 | Exceptional 98.6% |
| Dutch | 100.0 /100 | #16 | Exceptional 98.6% |
| Aleuts | 100.0 /100 | #17 | Exceptional 98.6% |
| Irish | 100.0 /100 | #18 | Exceptional 98.6% |
| Finns | 100.0 /100 | #19 | Exceptional 98.5% |
| Sioux | 100.0 /100 | #20 | Exceptional 98.5% |