Immigrants from Northern Europe vs Portuguese 8th Grade
COMPARE
Immigrants from Northern Europe
Portuguese
8th Grade
8th Grade Comparison
Immigrants from Northern Europe
Portuguese
96.7%
8TH GRADE
99.8/ 100
METRIC RATING
60th/ 347
METRIC RANK
95.5%
8TH GRADE
14.3/ 100
METRIC RATING
208th/ 347
METRIC RANK
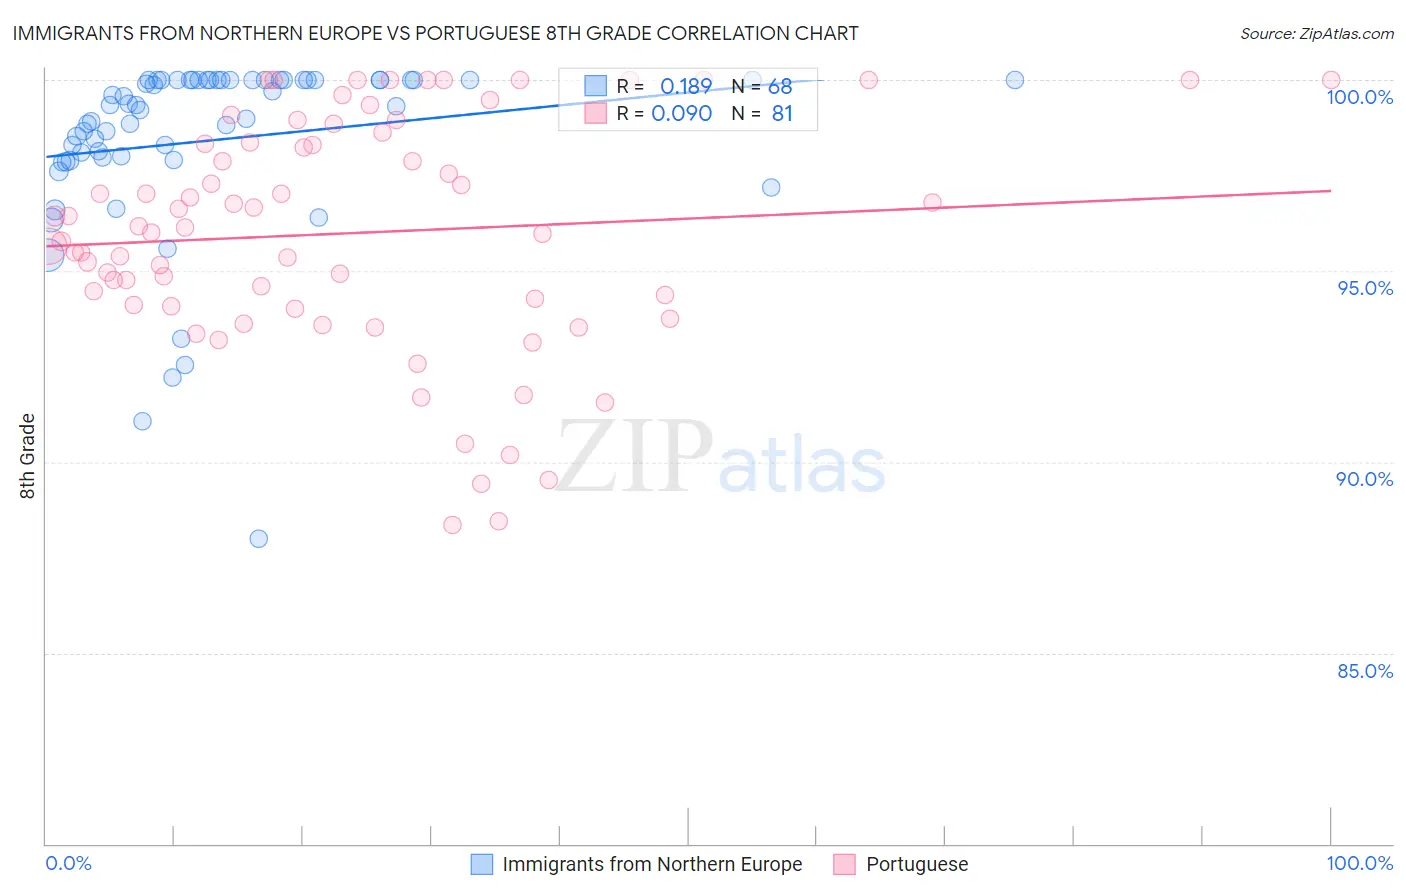
Immigrants from Northern Europe vs Portuguese 8th Grade Correlation Chart
The statistical analysis conducted on geographies consisting of 477,226,562 people shows a poor positive correlation between the proportion of Immigrants from Northern Europe and percentage of population with at least 8th grade education in the United States with a correlation coefficient (R) of 0.189 and weighted average of 96.7%. Similarly, the statistical analysis conducted on geographies consisting of 450,343,001 people shows a slight positive correlation between the proportion of Portuguese and percentage of population with at least 8th grade education in the United States with a correlation coefficient (R) of 0.090 and weighted average of 95.5%, a difference of 1.3%.
8th Grade Correlation Summary
| Measurement | Immigrants from Northern Europe | Portuguese |
| Minimum | 88.0% | 88.3% |
| Maximum | 100.0% | 100.0% |
| Range | 12.0% | 11.7% |
| Mean | 98.4% | 96.0% |
| Median | 99.3% | 96.1% |
| Interquartile 25% (IQ1) | 97.9% | 94.1% |
| Interquartile 75% (IQ3) | 100.0% | 98.5% |
| Interquartile Range (IQR) | 2.1% | 4.4% |
| Standard Deviation (Sample) | 2.4% | 3.0% |
| Standard Deviation (Population) | 2.4% | 3.0% |
Similar Demographics by 8th Grade
Demographics Similar to Immigrants from Northern Europe by 8th Grade
In terms of 8th grade, the demographic groups most similar to Immigrants from Northern Europe are Immigrants from North America (96.7%, a difference of 0.0%), Immigrants from Austria (96.7%, a difference of 0.0%), Immigrants from Canada (96.7%, a difference of 0.020%), White/Caucasian (96.7%, a difference of 0.020%), and Ukrainian (96.7%, a difference of 0.030%).
| Demographics | Rating | Rank | 8th Grade |
| Austrians | 99.9 /100 | #53 | Exceptional 96.7% |
| Serbians | 99.8 /100 | #54 | Exceptional 96.7% |
| Russians | 99.8 /100 | #55 | Exceptional 96.7% |
| Australians | 99.8 /100 | #56 | Exceptional 96.7% |
| Macedonians | 99.8 /100 | #57 | Exceptional 96.7% |
| Immigrants | Canada | 99.8 /100 | #58 | Exceptional 96.7% |
| Immigrants | North America | 99.8 /100 | #59 | Exceptional 96.7% |
| Immigrants | Northern Europe | 99.8 /100 | #60 | Exceptional 96.7% |
| Immigrants | Austria | 99.8 /100 | #61 | Exceptional 96.7% |
| Whites/Caucasians | 99.8 /100 | #62 | Exceptional 96.7% |
| Ukrainians | 99.7 /100 | #63 | Exceptional 96.7% |
| Immigrants | India | 99.7 /100 | #64 | Exceptional 96.6% |
| Native Hawaiians | 99.7 /100 | #65 | Exceptional 96.6% |
| Canadians | 99.7 /100 | #66 | Exceptional 96.6% |
| Iranians | 99.7 /100 | #67 | Exceptional 96.6% |
Demographics Similar to Portuguese by 8th Grade
In terms of 8th grade, the demographic groups most similar to Portuguese are Immigrants from Sudan (95.5%, a difference of 0.010%), Immigrants from Lebanon (95.4%, a difference of 0.010%), African (95.4%, a difference of 0.010%), Hawaiian (95.5%, a difference of 0.030%), and Immigrants from Bahamas (95.5%, a difference of 0.030%).
| Demographics | Rating | Rank | 8th Grade |
| Immigrants | Argentina | 20.6 /100 | #201 | Fair 95.5% |
| Apache | 19.4 /100 | #202 | Poor 95.5% |
| Moroccans | 17.4 /100 | #203 | Poor 95.5% |
| Hawaiians | 16.7 /100 | #204 | Poor 95.5% |
| Immigrants | Bahamas | 16.7 /100 | #205 | Poor 95.5% |
| Comanche | 16.3 /100 | #206 | Poor 95.5% |
| Immigrants | Sudan | 15.1 /100 | #207 | Poor 95.5% |
| Portuguese | 14.3 /100 | #208 | Poor 95.5% |
| Immigrants | Lebanon | 13.7 /100 | #209 | Poor 95.4% |
| Africans | 13.6 /100 | #210 | Poor 95.4% |
| Immigrants | Morocco | 12.4 /100 | #211 | Poor 95.4% |
| Immigrants | Pakistan | 9.7 /100 | #212 | Tragic 95.4% |
| Laotians | 9.0 /100 | #213 | Tragic 95.4% |
| Immigrants | Chile | 9.0 /100 | #214 | Tragic 95.4% |
| Immigrants | Liberia | 8.9 /100 | #215 | Tragic 95.4% |