Immigrants from Northern Africa vs English No Schooling Completed
COMPARE
Immigrants from Northern Africa
English
No Schooling Completed
No Schooling Completed Comparison
Immigrants from Northern Africa
English
2.2%
NO SCHOOLING COMPLETED
19.5/ 100
METRIC RATING
200th/ 347
METRIC RANK
1.4%
NO SCHOOLING COMPLETED
100.0/ 100
METRIC RATING
7th/ 347
METRIC RANK
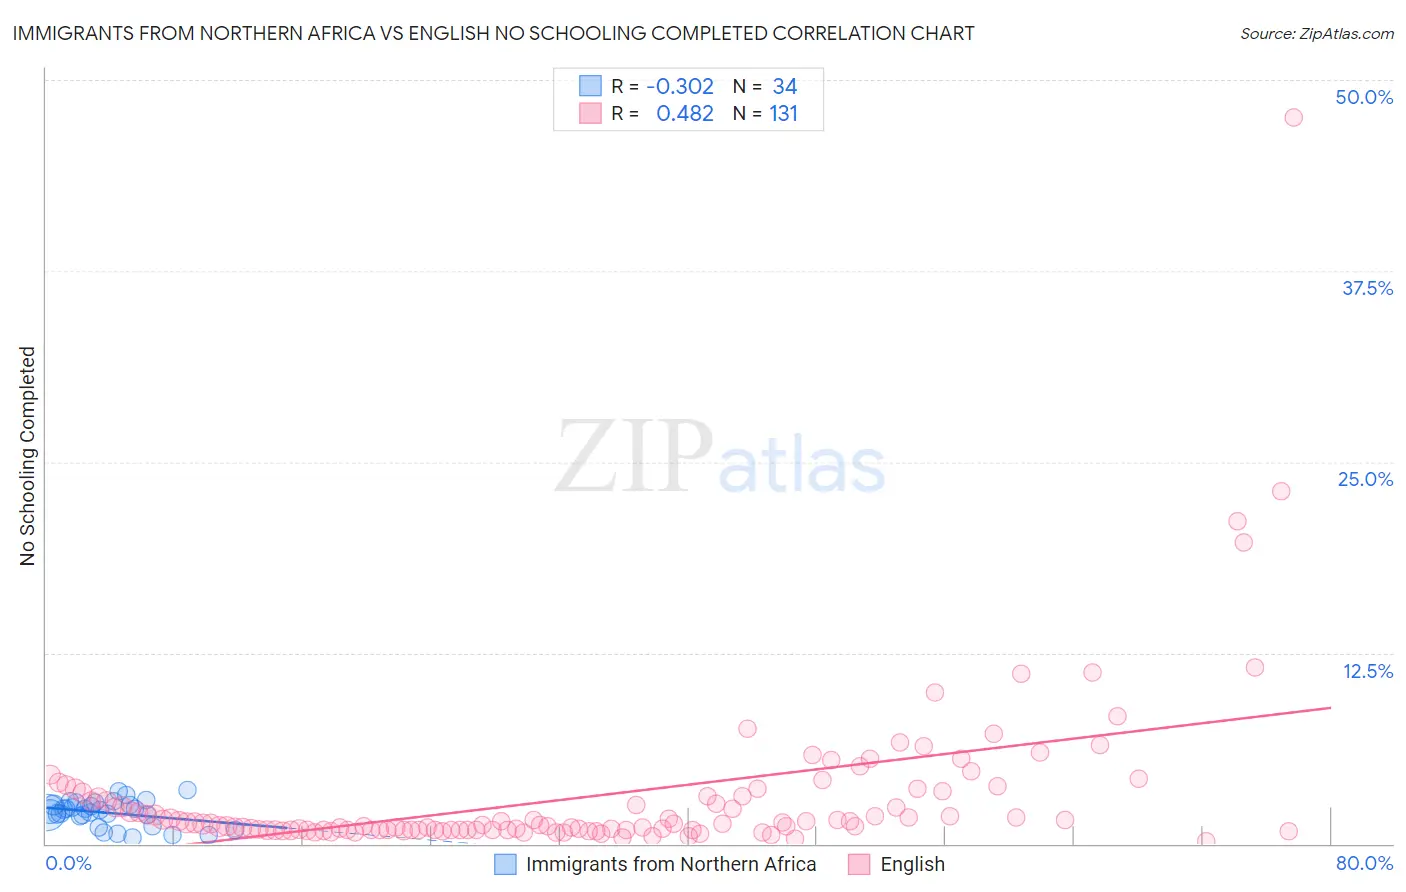
Immigrants from Northern Africa vs English No Schooling Completed Correlation Chart
The statistical analysis conducted on geographies consisting of 319,330,485 people shows a mild negative correlation between the proportion of Immigrants from Northern Africa and percentage of population with no schooling in the United States with a correlation coefficient (R) of -0.302 and weighted average of 2.2%. Similarly, the statistical analysis conducted on geographies consisting of 558,251,805 people shows a moderate positive correlation between the proportion of English and percentage of population with no schooling in the United States with a correlation coefficient (R) of 0.482 and weighted average of 1.4%, a difference of 58.1%.
No Schooling Completed Correlation Summary
| Measurement | Immigrants from Northern Africa | English |
| Minimum | 0.40% | 0.18% |
| Maximum | 3.5% | 47.5% |
| Range | 3.1% | 47.3% |
| Mean | 2.0% | 3.1% |
| Median | 2.1% | 1.3% |
| Interquartile 25% (IQ1) | 1.8% | 0.90% |
| Interquartile 75% (IQ3) | 2.6% | 3.1% |
| Interquartile Range (IQR) | 0.74% | 2.2% |
| Standard Deviation (Sample) | 0.84% | 5.4% |
| Standard Deviation (Population) | 0.83% | 5.3% |
Similar Demographics by No Schooling Completed
Demographics Similar to Immigrants from Northern Africa by No Schooling Completed
In terms of no schooling completed, the demographic groups most similar to Immigrants from Northern Africa are African (2.2%, a difference of 0.46%), Costa Rican (2.2%, a difference of 0.52%), Immigrants from Chile (2.2%, a difference of 0.64%), Immigrants from Southern Europe (2.2%, a difference of 0.82%), and Immigrants from Ukraine (2.2%, a difference of 1.2%).
| Demographics | Rating | Rank | No Schooling Completed |
| Paraguayans | 29.3 /100 | #193 | Fair 2.2% |
| Immigrants | Albania | 28.3 /100 | #194 | Fair 2.2% |
| Hawaiians | 27.0 /100 | #195 | Fair 2.2% |
| Immigrants | Ukraine | 26.1 /100 | #196 | Fair 2.2% |
| Immigrants | Southern Europe | 23.8 /100 | #197 | Fair 2.2% |
| Immigrants | Chile | 22.7 /100 | #198 | Fair 2.2% |
| Africans | 21.8 /100 | #199 | Fair 2.2% |
| Immigrants | Northern Africa | 19.5 /100 | #200 | Poor 2.2% |
| Costa Ricans | 17.1 /100 | #201 | Poor 2.2% |
| Moroccans | 13.7 /100 | #202 | Poor 2.2% |
| Laotians | 13.3 /100 | #203 | Poor 2.2% |
| Hopi | 12.9 /100 | #204 | Poor 2.2% |
| Immigrants | Bahamas | 11.6 /100 | #205 | Poor 2.2% |
| Bahamians | 11.6 /100 | #206 | Poor 2.2% |
| South American Indians | 11.0 /100 | #207 | Poor 2.2% |
Demographics Similar to English by No Schooling Completed
In terms of no schooling completed, the demographic groups most similar to English are Carpatho Rusyn (1.4%, a difference of 0.97%), Swedish (1.4%, a difference of 1.5%), Slovene (1.4%, a difference of 1.8%), Scottish (1.4%, a difference of 2.0%), and German (1.4%, a difference of 2.2%).
| Demographics | Rating | Rank | No Schooling Completed |
| Yup'ik | 100.0 /100 | #1 | Exceptional 1.2% |
| Slovaks | 100.0 /100 | #2 | Exceptional 1.3% |
| Norwegians | 100.0 /100 | #3 | Exceptional 1.3% |
| Germans | 100.0 /100 | #4 | Exceptional 1.4% |
| Slovenes | 100.0 /100 | #5 | Exceptional 1.4% |
| Carpatho Rusyns | 100.0 /100 | #6 | Exceptional 1.4% |
| English | 100.0 /100 | #7 | Exceptional 1.4% |
| Swedes | 100.0 /100 | #8 | Exceptional 1.4% |
| Scottish | 100.0 /100 | #9 | Exceptional 1.4% |
| Dutch | 100.0 /100 | #10 | Exceptional 1.4% |
| Lithuanians | 100.0 /100 | #11 | Exceptional 1.4% |
| Irish | 100.0 /100 | #12 | Exceptional 1.4% |
| Poles | 100.0 /100 | #13 | Exceptional 1.4% |
| Scotch-Irish | 100.0 /100 | #14 | Exceptional 1.5% |
| Tlingit-Haida | 100.0 /100 | #15 | Exceptional 1.5% |