Immigrants from North Macedonia vs Shoshone 8th Grade
COMPARE
Immigrants from North Macedonia
Shoshone
8th Grade
8th Grade Comparison
Immigrants from North Macedonia
Shoshone
96.3%
8TH GRADE
98.0/ 100
METRIC RATING
105th/ 347
METRIC RANK
96.3%
8TH GRADE
96.8/ 100
METRIC RATING
111th/ 347
METRIC RANK
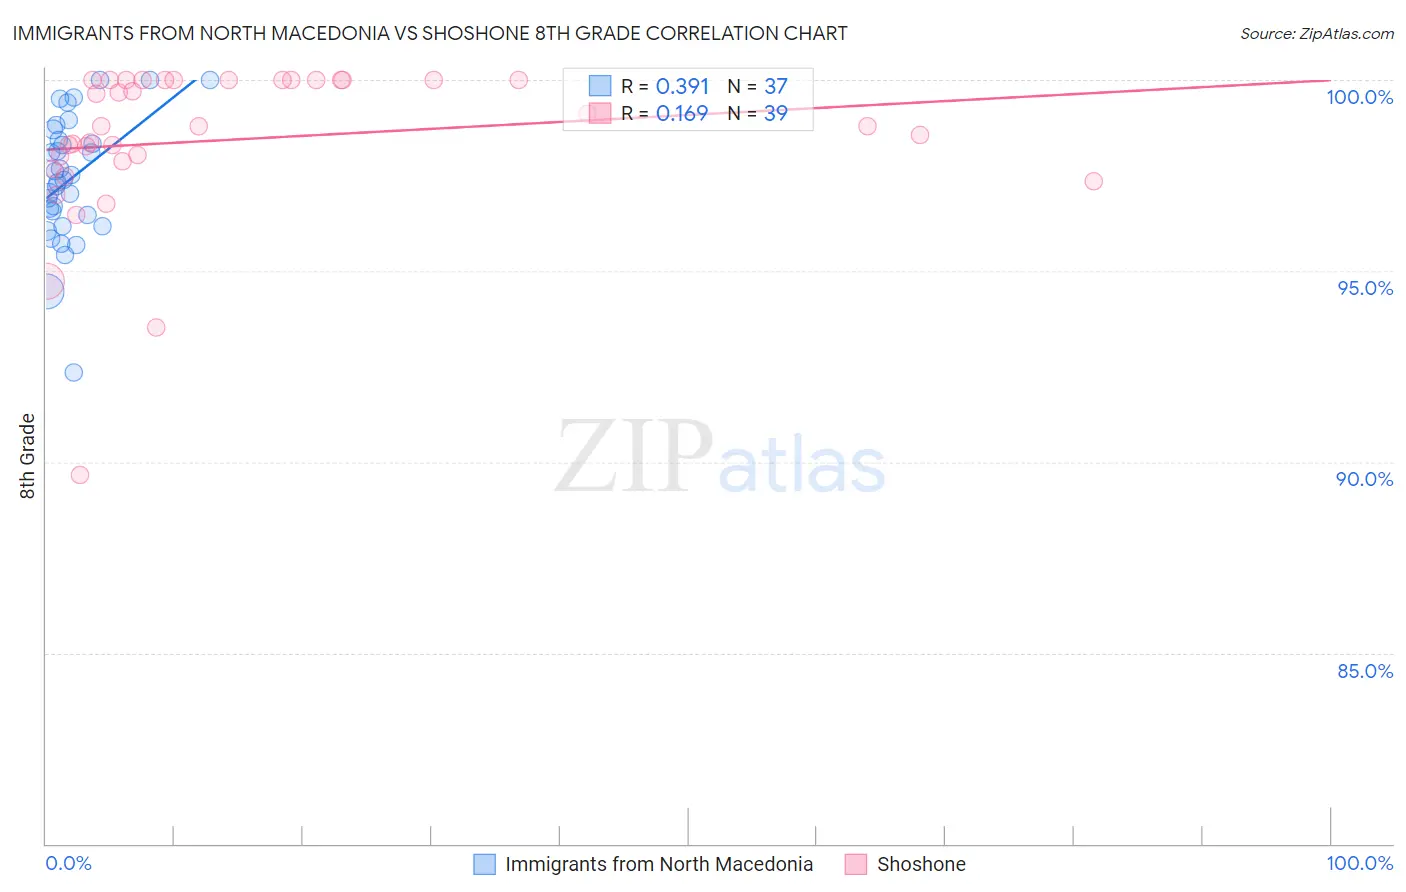
Immigrants from North Macedonia vs Shoshone 8th Grade Correlation Chart
The statistical analysis conducted on geographies consisting of 74,252,242 people shows a mild positive correlation between the proportion of Immigrants from North Macedonia and percentage of population with at least 8th grade education in the United States with a correlation coefficient (R) of 0.391 and weighted average of 96.3%. Similarly, the statistical analysis conducted on geographies consisting of 66,625,086 people shows a poor positive correlation between the proportion of Shoshone and percentage of population with at least 8th grade education in the United States with a correlation coefficient (R) of 0.169 and weighted average of 96.3%, a difference of 0.080%.
8th Grade Correlation Summary
| Measurement | Immigrants from North Macedonia | Shoshone |
| Minimum | 92.3% | 89.7% |
| Maximum | 100.0% | 100.0% |
| Range | 7.7% | 10.3% |
| Mean | 97.4% | 98.4% |
| Median | 97.4% | 98.8% |
| Interquartile 25% (IQ1) | 96.3% | 97.9% |
| Interquartile 75% (IQ3) | 98.6% | 100.0% |
| Interquartile Range (IQR) | 2.2% | 2.1% |
| Standard Deviation (Sample) | 1.7% | 2.1% |
| Standard Deviation (Population) | 1.6% | 2.1% |
Demographics Similar to Immigrants from North Macedonia and Shoshone by 8th Grade
In terms of 8th grade, the demographic groups most similar to Immigrants from North Macedonia are Immigrants from Saudi Arabia (96.3%, a difference of 0.0%), Kiowa (96.3%, a difference of 0.0%), Okinawan (96.3%, a difference of 0.0%), South African (96.4%, a difference of 0.010%), and Immigrants from Latvia (96.3%, a difference of 0.010%). Similarly, the demographic groups most similar to Shoshone are Syrian (96.3%, a difference of 0.0%), Immigrants from Zimbabwe (96.3%, a difference of 0.010%), Immigrants from Japan (96.2%, a difference of 0.010%), Immigrants from Moldova (96.2%, a difference of 0.010%), and Cajun (96.3%, a difference of 0.020%).
| Demographics | Rating | Rank | 8th Grade |
| Immigrants | Germany | 98.7 /100 | #98 | Exceptional 96.4% |
| Cree | 98.6 /100 | #99 | Exceptional 96.4% |
| Immigrants | Czechoslovakia | 98.6 /100 | #100 | Exceptional 96.4% |
| Bhutanese | 98.2 /100 | #101 | Exceptional 96.4% |
| South Africans | 98.2 /100 | #102 | Exceptional 96.4% |
| Immigrants | Saudi Arabia | 98.0 /100 | #103 | Exceptional 96.3% |
| Kiowa | 98.0 /100 | #104 | Exceptional 96.3% |
| Immigrants | North Macedonia | 98.0 /100 | #105 | Exceptional 96.3% |
| Okinawans | 98.0 /100 | #106 | Exceptional 96.3% |
| Immigrants | Latvia | 97.8 /100 | #107 | Exceptional 96.3% |
| Lebanese | 97.5 /100 | #108 | Exceptional 96.3% |
| Iroquois | 97.5 /100 | #109 | Exceptional 96.3% |
| Cajuns | 97.1 /100 | #110 | Exceptional 96.3% |
| Shoshone | 96.8 /100 | #111 | Exceptional 96.3% |
| Syrians | 96.7 /100 | #112 | Exceptional 96.3% |
| Immigrants | Zimbabwe | 96.7 /100 | #113 | Exceptional 96.3% |
| Immigrants | Japan | 96.5 /100 | #114 | Exceptional 96.2% |
| Immigrants | Moldova | 96.5 /100 | #115 | Exceptional 96.2% |
| Immigrants | Nonimmigrants | 96.0 /100 | #116 | Exceptional 96.2% |
| Immigrants | Croatia | 96.0 /100 | #117 | Exceptional 96.2% |
| Immigrants | Norway | 95.7 /100 | #118 | Exceptional 96.2% |