Immigrants from North Macedonia vs Scottish 9th Grade
COMPARE
Immigrants from North Macedonia
Scottish
9th Grade
9th Grade Comparison
Immigrants from North Macedonia
Scottish
95.3%
9TH GRADE
92.3/ 100
METRIC RATING
131st/ 347
METRIC RANK
96.5%
9TH GRADE
100.0/ 100
METRIC RATING
14th/ 347
METRIC RANK
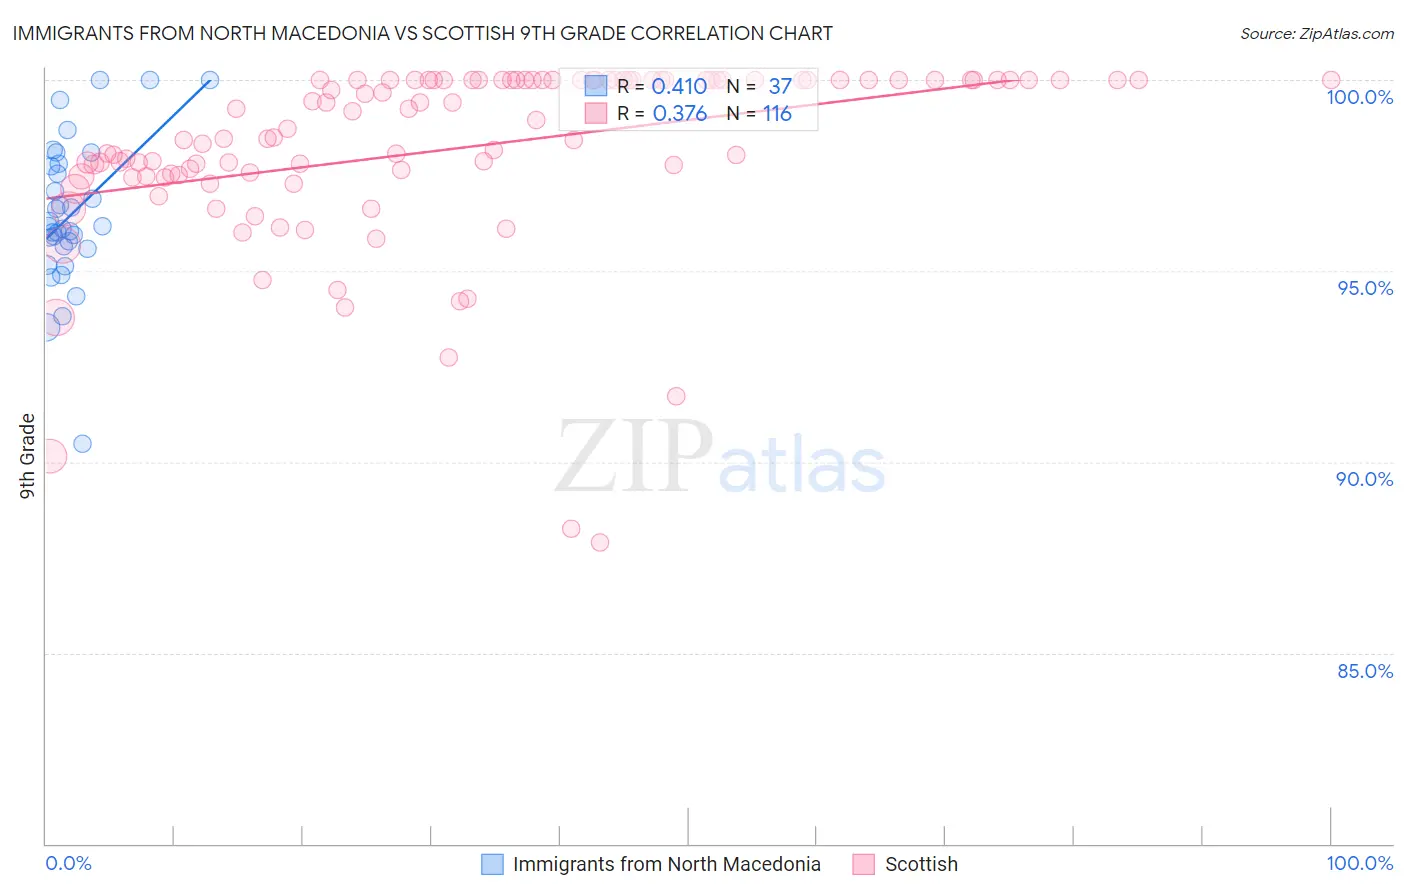
Immigrants from North Macedonia vs Scottish 9th Grade Correlation Chart
The statistical analysis conducted on geographies consisting of 74,300,344 people shows a moderate positive correlation between the proportion of Immigrants from North Macedonia and percentage of population with at least 9th grade education in the United States with a correlation coefficient (R) of 0.410 and weighted average of 95.3%. Similarly, the statistical analysis conducted on geographies consisting of 567,141,209 people shows a mild positive correlation between the proportion of Scottish and percentage of population with at least 9th grade education in the United States with a correlation coefficient (R) of 0.376 and weighted average of 96.5%, a difference of 1.3%.
9th Grade Correlation Summary
| Measurement | Immigrants from North Macedonia | Scottish |
| Minimum | 90.5% | 87.9% |
| Maximum | 100.0% | 100.0% |
| Range | 9.5% | 12.1% |
| Mean | 96.5% | 98.2% |
| Median | 96.2% | 98.8% |
| Interquartile 25% (IQ1) | 95.6% | 97.5% |
| Interquartile 75% (IQ3) | 97.8% | 100.0% |
| Interquartile Range (IQR) | 2.1% | 2.5% |
| Standard Deviation (Sample) | 1.9% | 2.4% |
| Standard Deviation (Population) | 1.9% | 2.4% |
Similar Demographics by 9th Grade
Demographics Similar to Immigrants from North Macedonia by 9th Grade
In terms of 9th grade, the demographic groups most similar to Immigrants from North Macedonia are Nonimmigrants (95.3%, a difference of 0.010%), Jordanian (95.3%, a difference of 0.030%), Israeli (95.3%, a difference of 0.040%), Basque (95.4%, a difference of 0.050%), and Immigrants from Serbia (95.4%, a difference of 0.060%).
| Demographics | Rating | Rank | 9th Grade |
| Shoshone | 95.3 /100 | #124 | Exceptional 95.4% |
| Immigrants | South Central Asia | 95.1 /100 | #125 | Exceptional 95.4% |
| Immigrants | Serbia | 94.4 /100 | #126 | Exceptional 95.4% |
| Palestinians | 94.3 /100 | #127 | Exceptional 95.4% |
| Immigrants | Hungary | 94.2 /100 | #128 | Exceptional 95.4% |
| Basques | 94.1 /100 | #129 | Exceptional 95.4% |
| Jordanians | 93.5 /100 | #130 | Exceptional 95.3% |
| Immigrants | North Macedonia | 92.3 /100 | #131 | Exceptional 95.3% |
| Immigrants | Nonimmigrants | 92.0 /100 | #132 | Exceptional 95.3% |
| Israelis | 90.4 /100 | #133 | Exceptional 95.3% |
| Immigrants | Israel | 89.6 /100 | #134 | Excellent 95.3% |
| Immigrants | Belarus | 88.9 /100 | #135 | Excellent 95.2% |
| Immigrants | Iran | 88.3 /100 | #136 | Excellent 95.2% |
| Hmong | 87.7 /100 | #137 | Excellent 95.2% |
| Immigrants | Russia | 86.6 /100 | #138 | Excellent 95.2% |
Demographics Similar to Scottish by 9th Grade
In terms of 9th grade, the demographic groups most similar to Scottish are Irish (96.5%, a difference of 0.0%), Croatian (96.5%, a difference of 0.0%), Danish (96.5%, a difference of 0.010%), English (96.6%, a difference of 0.050%), and Lithuanian (96.6%, a difference of 0.070%).
| Demographics | Rating | Rank | 9th Grade |
| Carpatho Rusyns | 100.0 /100 | #7 | Exceptional 96.7% |
| Germans | 100.0 /100 | #8 | Exceptional 96.7% |
| Tlingit-Haida | 100.0 /100 | #9 | Exceptional 96.6% |
| Lithuanians | 100.0 /100 | #10 | Exceptional 96.6% |
| Finns | 100.0 /100 | #11 | Exceptional 96.6% |
| English | 100.0 /100 | #12 | Exceptional 96.6% |
| Danes | 100.0 /100 | #13 | Exceptional 96.5% |
| Scottish | 100.0 /100 | #14 | Exceptional 96.5% |
| Irish | 100.0 /100 | #15 | Exceptional 96.5% |
| Croatians | 100.0 /100 | #16 | Exceptional 96.5% |
| Dutch | 100.0 /100 | #17 | Exceptional 96.5% |
| Scandinavians | 100.0 /100 | #18 | Exceptional 96.5% |
| Welsh | 100.0 /100 | #19 | Exceptional 96.4% |
| Italians | 100.0 /100 | #20 | Exceptional 96.4% |
| Alaskan Athabascans | 100.0 /100 | #21 | Exceptional 96.4% |