Immigrants from North America vs Seminole 9th Grade
COMPARE
Immigrants from North America
Seminole
9th Grade
9th Grade Comparison
Immigrants from North America
Seminole
96.0%
9TH GRADE
99.8/ 100
METRIC RATING
56th/ 347
METRIC RANK
94.8%
9TH GRADE
42.5/ 100
METRIC RATING
182nd/ 347
METRIC RANK
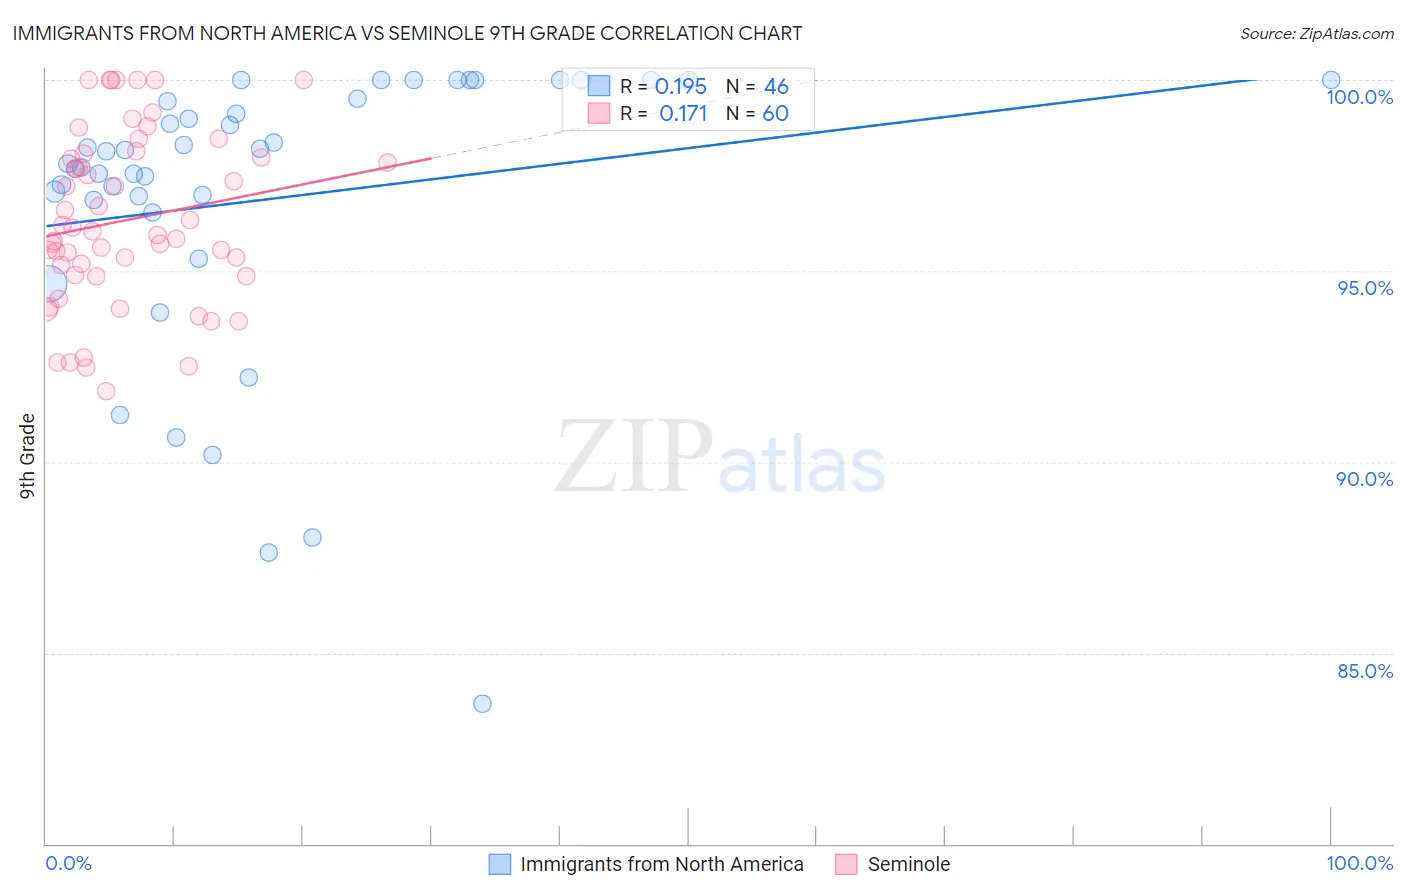
Immigrants from North America vs Seminole 9th Grade Correlation Chart
The statistical analysis conducted on geographies consisting of 462,462,229 people shows a poor positive correlation between the proportion of Immigrants from North America and percentage of population with at least 9th grade education in the United States with a correlation coefficient (R) of 0.195 and weighted average of 96.0%. Similarly, the statistical analysis conducted on geographies consisting of 118,314,042 people shows a poor positive correlation between the proportion of Seminole and percentage of population with at least 9th grade education in the United States with a correlation coefficient (R) of 0.171 and weighted average of 94.8%, a difference of 1.2%.
9th Grade Correlation Summary
| Measurement | Immigrants from North America | Seminole |
| Minimum | 83.7% | 91.9% |
| Maximum | 100.0% | 100.0% |
| Range | 16.3% | 8.1% |
| Mean | 96.9% | 96.3% |
| Median | 98.0% | 96.0% |
| Interquartile 25% (IQ1) | 96.8% | 94.9% |
| Interquartile 75% (IQ3) | 99.5% | 98.0% |
| Interquartile Range (IQR) | 2.7% | 3.1% |
| Standard Deviation (Sample) | 3.8% | 2.2% |
| Standard Deviation (Population) | 3.7% | 2.2% |
Similar Demographics by 9th Grade
Demographics Similar to Immigrants from North America by 9th Grade
In terms of 9th grade, the demographic groups most similar to Immigrants from North America are Immigrants from Austria (96.0%, a difference of 0.0%), Macedonian (96.0%, a difference of 0.010%), Aleut (96.0%, a difference of 0.010%), Immigrants from Canada (96.0%, a difference of 0.020%), and Austrian (96.0%, a difference of 0.030%).
| Demographics | Rating | Rank | 9th Grade |
| Greeks | 99.9 /100 | #49 | Exceptional 96.0% |
| Celtics | 99.9 /100 | #50 | Exceptional 96.0% |
| Immigrants | Northern Europe | 99.9 /100 | #51 | Exceptional 96.0% |
| Serbians | 99.9 /100 | #52 | Exceptional 96.0% |
| Austrians | 99.8 /100 | #53 | Exceptional 96.0% |
| Immigrants | Canada | 99.8 /100 | #54 | Exceptional 96.0% |
| Immigrants | Austria | 99.8 /100 | #55 | Exceptional 96.0% |
| Immigrants | North America | 99.8 /100 | #56 | Exceptional 96.0% |
| Macedonians | 99.8 /100 | #57 | Exceptional 96.0% |
| Aleuts | 99.8 /100 | #58 | Exceptional 96.0% |
| New Zealanders | 99.8 /100 | #59 | Exceptional 95.9% |
| Native Hawaiians | 99.8 /100 | #60 | Exceptional 95.9% |
| Sioux | 99.8 /100 | #61 | Exceptional 95.9% |
| Ukrainians | 99.7 /100 | #62 | Exceptional 95.9% |
| Canadians | 99.7 /100 | #63 | Exceptional 95.9% |
Demographics Similar to Seminole by 9th Grade
In terms of 9th grade, the demographic groups most similar to Seminole are Immigrants from Uganda (94.8%, a difference of 0.0%), Sierra Leonean (94.8%, a difference of 0.0%), Immigrants from Nepal (94.8%, a difference of 0.020%), Immigrants from Poland (94.9%, a difference of 0.030%), and Immigrants from Venezuela (94.9%, a difference of 0.030%).
| Demographics | Rating | Rank | 9th Grade |
| Brazilians | 49.8 /100 | #175 | Average 94.9% |
| Immigrants | Spain | 49.1 /100 | #176 | Average 94.9% |
| Immigrants | Iraq | 47.8 /100 | #177 | Average 94.9% |
| Immigrants | Poland | 46.7 /100 | #178 | Average 94.9% |
| Immigrants | Venezuela | 46.5 /100 | #179 | Average 94.9% |
| Immigrants | Uganda | 43.1 /100 | #180 | Average 94.8% |
| Sierra Leoneans | 42.7 /100 | #181 | Average 94.8% |
| Seminole | 42.5 /100 | #182 | Average 94.8% |
| Immigrants | Nepal | 39.7 /100 | #183 | Fair 94.8% |
| Argentineans | 37.6 /100 | #184 | Fair 94.8% |
| Liberians | 37.4 /100 | #185 | Fair 94.8% |
| Hopi | 37.1 /100 | #186 | Fair 94.8% |
| Guamanians/Chamorros | 35.5 /100 | #187 | Fair 94.8% |
| Immigrants | Albania | 34.5 /100 | #188 | Fair 94.8% |
| Immigrants | Argentina | 34.4 /100 | #189 | Fair 94.8% |