Immigrants from North America vs Scotch-Irish Nursery School
COMPARE
Immigrants from North America
Scotch-Irish
Nursery School
Nursery School Comparison
Immigrants from North America
Scotch-Irish
98.4%
NURSERY SCHOOL
99.7/ 100
METRIC RATING
63rd/ 347
METRIC RANK
98.6%
NURSERY SCHOOL
100.0/ 100
METRIC RATING
25th/ 347
METRIC RANK
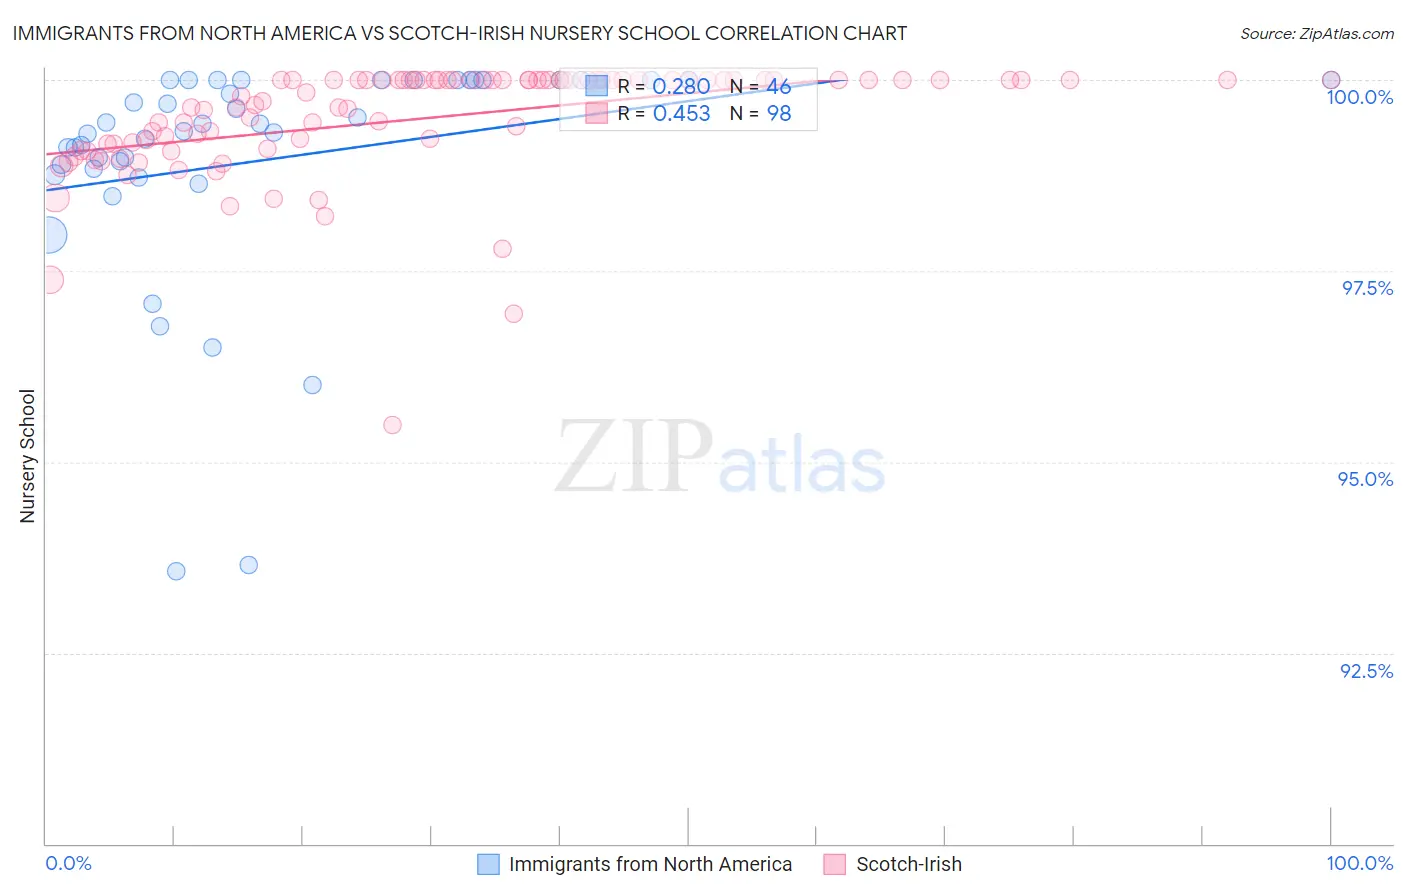
Immigrants from North America vs Scotch-Irish Nursery School Correlation Chart
The statistical analysis conducted on geographies consisting of 462,462,400 people shows a weak positive correlation between the proportion of Immigrants from North America and percentage of population with at least nursery school education in the United States with a correlation coefficient (R) of 0.280 and weighted average of 98.4%. Similarly, the statistical analysis conducted on geographies consisting of 548,777,407 people shows a moderate positive correlation between the proportion of Scotch-Irish and percentage of population with at least nursery school education in the United States with a correlation coefficient (R) of 0.453 and weighted average of 98.6%, a difference of 0.21%.
Nursery School Correlation Summary
| Measurement | Immigrants from North America | Scotch-Irish |
| Minimum | 93.6% | 95.5% |
| Maximum | 100.0% | 100.0% |
| Range | 6.4% | 4.5% |
| Mean | 99.0% | 99.5% |
| Median | 99.4% | 99.9% |
| Interquartile 25% (IQ1) | 98.8% | 99.2% |
| Interquartile 75% (IQ3) | 100.0% | 100.0% |
| Interquartile Range (IQR) | 1.2% | 0.84% |
| Standard Deviation (Sample) | 1.5% | 0.75% |
| Standard Deviation (Population) | 1.5% | 0.75% |
Similar Demographics by Nursery School
Demographics Similar to Immigrants from North America by Nursery School
In terms of nursery school, the demographic groups most similar to Immigrants from North America are Immigrants from Canada (98.4%, a difference of 0.0%), Slavic (98.4%, a difference of 0.0%), New Zealander (98.4%, a difference of 0.0%), Creek (98.4%, a difference of 0.0%), and Greek (98.4%, a difference of 0.0%).
| Demographics | Rating | Rank | Nursery School |
| Americans | 99.8 /100 | #56 | Exceptional 98.4% |
| Austrians | 99.8 /100 | #57 | Exceptional 98.4% |
| Bulgarians | 99.8 /100 | #58 | Exceptional 98.4% |
| Immigrants | Canada | 99.8 /100 | #59 | Exceptional 98.4% |
| Slavs | 99.8 /100 | #60 | Exceptional 98.4% |
| New Zealanders | 99.7 /100 | #61 | Exceptional 98.4% |
| Creek | 99.7 /100 | #62 | Exceptional 98.4% |
| Immigrants | North America | 99.7 /100 | #63 | Exceptional 98.4% |
| Greeks | 99.7 /100 | #64 | Exceptional 98.4% |
| Maltese | 99.7 /100 | #65 | Exceptional 98.4% |
| Canadians | 99.7 /100 | #66 | Exceptional 98.4% |
| Immigrants | Northern Europe | 99.6 /100 | #67 | Exceptional 98.4% |
| Russians | 99.6 /100 | #68 | Exceptional 98.4% |
| Immigrants | Austria | 99.6 /100 | #69 | Exceptional 98.4% |
| Cheyenne | 99.6 /100 | #70 | Exceptional 98.4% |
Demographics Similar to Scotch-Irish by Nursery School
In terms of nursery school, the demographic groups most similar to Scotch-Irish are Finnish (98.6%, a difference of 0.0%), Lithuanian (98.6%, a difference of 0.0%), Polish (98.6%, a difference of 0.0%), Danish (98.6%, a difference of 0.0%), and Sioux (98.6%, a difference of 0.0%).
| Demographics | Rating | Rank | Nursery School |
| Dutch | 100.0 /100 | #18 | Exceptional 98.7% |
| Irish | 100.0 /100 | #19 | Exceptional 98.6% |
| Pennsylvania Germans | 100.0 /100 | #20 | Exceptional 98.6% |
| Finns | 100.0 /100 | #21 | Exceptional 98.6% |
| Lithuanians | 100.0 /100 | #22 | Exceptional 98.6% |
| Poles | 100.0 /100 | #23 | Exceptional 98.6% |
| Danes | 100.0 /100 | #24 | Exceptional 98.6% |
| Scotch-Irish | 100.0 /100 | #25 | Exceptional 98.6% |
| Sioux | 100.0 /100 | #26 | Exceptional 98.6% |
| Arapaho | 100.0 /100 | #27 | Exceptional 98.6% |
| Croatians | 100.0 /100 | #28 | Exceptional 98.6% |
| French | 100.0 /100 | #29 | Exceptional 98.6% |
| Europeans | 100.0 /100 | #30 | Exceptional 98.6% |
| Czechs | 100.0 /100 | #31 | Exceptional 98.6% |
| French Canadians | 100.0 /100 | #32 | Exceptional 98.6% |