Immigrants from North America vs Navajo 2nd Grade
COMPARE
Immigrants from North America
Navajo
2nd Grade
2nd Grade Comparison
Immigrants from North America
Navajo
98.3%
2ND GRADE
99.7/ 100
METRIC RATING
64th/ 347
METRIC RANK
97.9%
2ND GRADE
54.3/ 100
METRIC RATING
170th/ 347
METRIC RANK
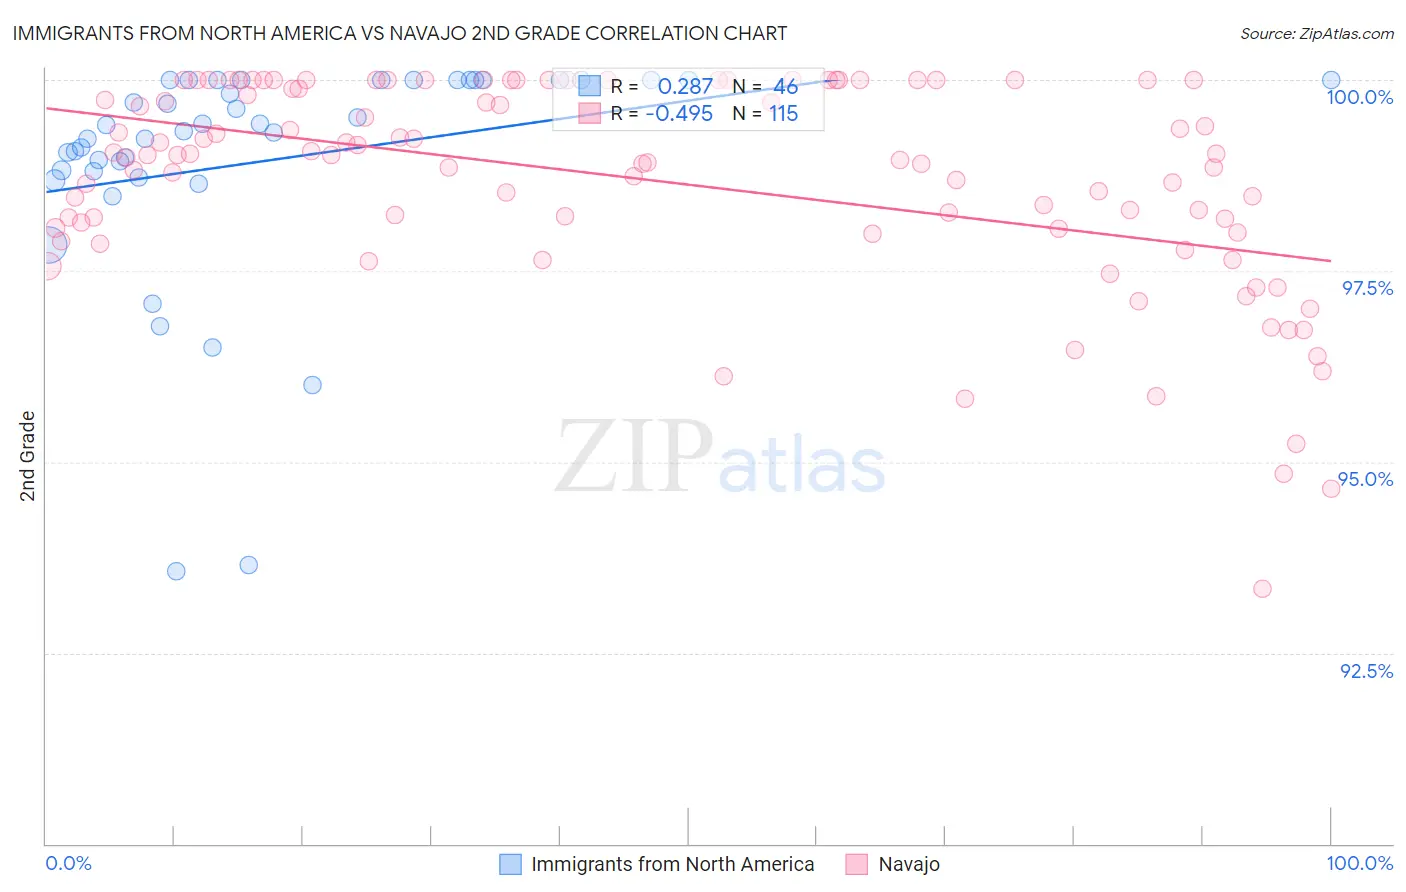
Immigrants from North America vs Navajo 2nd Grade Correlation Chart
The statistical analysis conducted on geographies consisting of 462,462,400 people shows a weak positive correlation between the proportion of Immigrants from North America and percentage of population with at least 2nd grade education in the United States with a correlation coefficient (R) of 0.287 and weighted average of 98.3%. Similarly, the statistical analysis conducted on geographies consisting of 224,872,493 people shows a moderate negative correlation between the proportion of Navajo and percentage of population with at least 2nd grade education in the United States with a correlation coefficient (R) of -0.495 and weighted average of 97.9%, a difference of 0.46%.
2nd Grade Correlation Summary
| Measurement | Immigrants from North America | Navajo |
| Minimum | 93.6% | 93.3% |
| Maximum | 100.0% | 100.0% |
| Range | 6.4% | 6.7% |
| Mean | 98.9% | 98.7% |
| Median | 99.4% | 99.0% |
| Interquartile 25% (IQ1) | 98.8% | 98.0% |
| Interquartile 75% (IQ3) | 100.0% | 100.0% |
| Interquartile Range (IQR) | 1.2% | 2.0% |
| Standard Deviation (Sample) | 1.5% | 1.4% |
| Standard Deviation (Population) | 1.5% | 1.4% |
Similar Demographics by 2nd Grade
Demographics Similar to Immigrants from North America by 2nd Grade
In terms of 2nd grade, the demographic groups most similar to Immigrants from North America are Immigrants from Canada (98.3%, a difference of 0.0%), Greek (98.3%, a difference of 0.0%), Maltese (98.3%, a difference of 0.0%), Austrian (98.3%, a difference of 0.010%), and Bulgarian (98.3%, a difference of 0.010%).
| Demographics | Rating | Rank | 2nd Grade |
| Austrians | 99.8 /100 | #57 | Exceptional 98.3% |
| Bulgarians | 99.8 /100 | #58 | Exceptional 98.3% |
| Slavs | 99.8 /100 | #59 | Exceptional 98.3% |
| Creek | 99.8 /100 | #60 | Exceptional 98.3% |
| Immigrants | Canada | 99.8 /100 | #61 | Exceptional 98.3% |
| Greeks | 99.8 /100 | #62 | Exceptional 98.3% |
| Maltese | 99.7 /100 | #63 | Exceptional 98.3% |
| Immigrants | North America | 99.7 /100 | #64 | Exceptional 98.3% |
| New Zealanders | 99.7 /100 | #65 | Exceptional 98.3% |
| Canadians | 99.7 /100 | #66 | Exceptional 98.3% |
| Immigrants | Northern Europe | 99.7 /100 | #67 | Exceptional 98.3% |
| Russians | 99.7 /100 | #68 | Exceptional 98.3% |
| Immigrants | Austria | 99.6 /100 | #69 | Exceptional 98.3% |
| Serbians | 99.6 /100 | #70 | Exceptional 98.3% |
| Chickasaw | 99.6 /100 | #71 | Exceptional 98.3% |
Demographics Similar to Navajo by 2nd Grade
In terms of 2nd grade, the demographic groups most similar to Navajo are Brazilian (97.9%, a difference of 0.0%), Immigrants from Spain (97.9%, a difference of 0.0%), Albanian (97.9%, a difference of 0.0%), Ugandan (97.9%, a difference of 0.010%), and Spanish American (97.9%, a difference of 0.010%).
| Demographics | Rating | Rank | 2nd Grade |
| Bermudans | 59.4 /100 | #163 | Average 97.9% |
| Ugandans | 56.6 /100 | #164 | Average 97.9% |
| Spanish Americans | 56.4 /100 | #165 | Average 97.9% |
| Immigrants | Jordan | 56.3 /100 | #166 | Average 97.9% |
| Chileans | 56.1 /100 | #167 | Average 97.9% |
| Brazilians | 55.8 /100 | #168 | Average 97.9% |
| Immigrants | Spain | 55.4 /100 | #169 | Average 97.9% |
| Navajo | 54.3 /100 | #170 | Average 97.9% |
| Albanians | 52.8 /100 | #171 | Average 97.9% |
| Immigrants | Korea | 52.7 /100 | #172 | Average 97.9% |
| Kenyans | 52.7 /100 | #173 | Average 97.9% |
| Immigrants | Micronesia | 50.0 /100 | #174 | Average 97.9% |
| Immigrants | Bosnia and Herzegovina | 49.8 /100 | #175 | Average 97.9% |
| Immigrants | Sri Lanka | 48.7 /100 | #176 | Average 97.9% |
| Immigrants | Brazil | 46.6 /100 | #177 | Average 97.9% |