Immigrants from North America vs Immigrants from North Macedonia 5th Grade
COMPARE
Immigrants from North America
Immigrants from North Macedonia
5th Grade
5th Grade Comparison
Immigrants from North America
Immigrants from North Macedonia
97.9%
5TH GRADE
99.7/ 100
METRIC RATING
62nd/ 347
METRIC RANK
97.5%
5TH GRADE
85.4/ 100
METRIC RATING
143rd/ 347
METRIC RANK
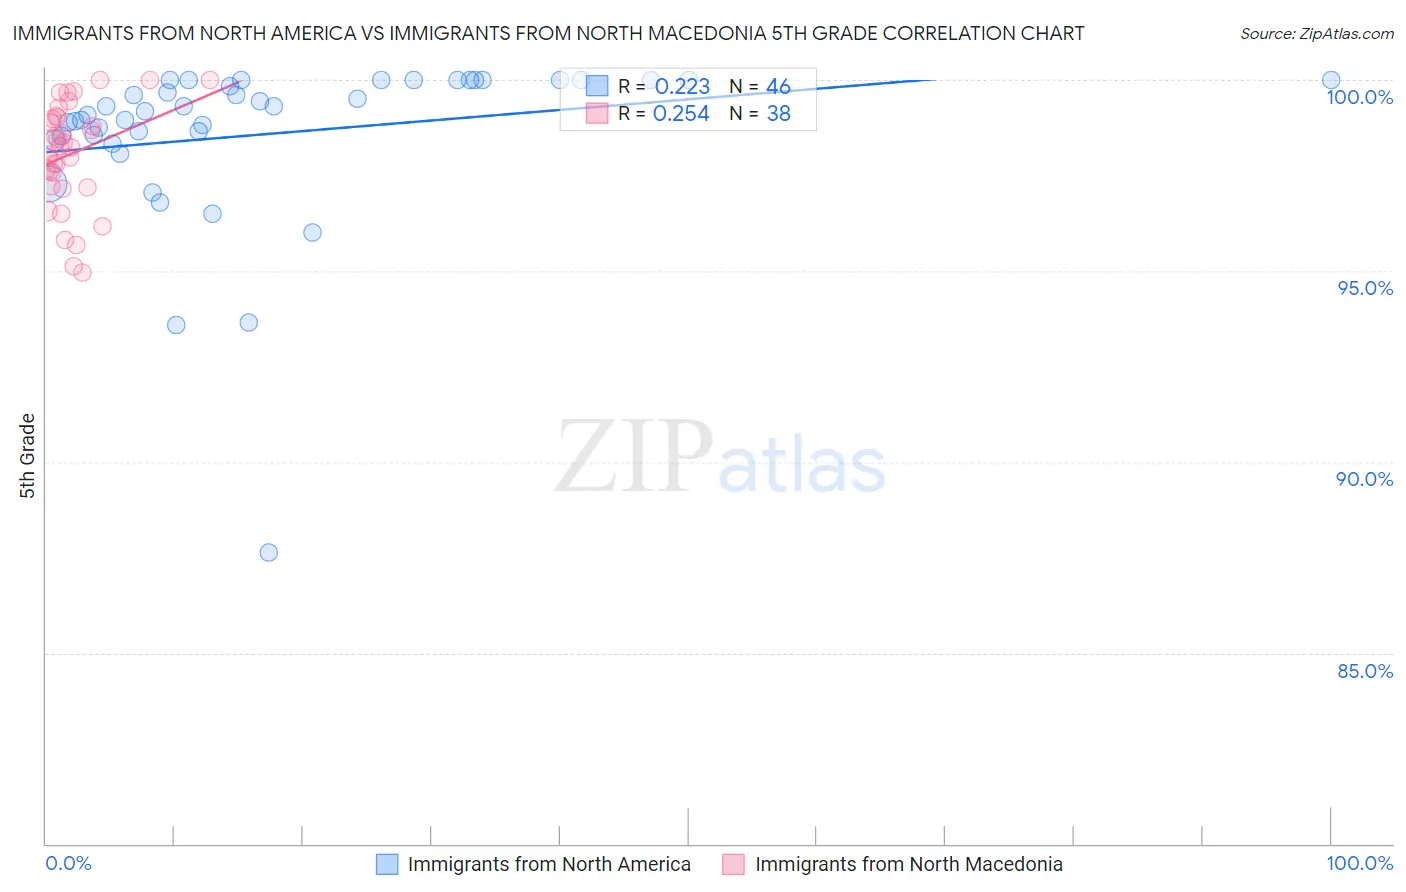
Immigrants from North America vs Immigrants from North Macedonia 5th Grade Correlation Chart
The statistical analysis conducted on geographies consisting of 462,462,330 people shows a weak positive correlation between the proportion of Immigrants from North America and percentage of population with at least 5th grade education in the United States with a correlation coefficient (R) of 0.223 and weighted average of 97.9%. Similarly, the statistical analysis conducted on geographies consisting of 74,317,186 people shows a weak positive correlation between the proportion of Immigrants from North Macedonia and percentage of population with at least 5th grade education in the United States with a correlation coefficient (R) of 0.254 and weighted average of 97.5%, a difference of 0.42%.
5th Grade Correlation Summary
| Measurement | Immigrants from North America | Immigrants from North Macedonia |
| Minimum | 87.6% | 95.0% |
| Maximum | 100.0% | 100.0% |
| Range | 12.4% | 5.0% |
| Mean | 98.6% | 98.1% |
| Median | 99.2% | 98.3% |
| Interquartile 25% (IQ1) | 98.5% | 97.2% |
| Interquartile 75% (IQ3) | 100.0% | 99.0% |
| Interquartile Range (IQR) | 1.5% | 1.8% |
| Standard Deviation (Sample) | 2.2% | 1.4% |
| Standard Deviation (Population) | 2.2% | 1.3% |
Similar Demographics by 5th Grade
Demographics Similar to Immigrants from North America by 5th Grade
In terms of 5th grade, the demographic groups most similar to Immigrants from North America are Serbian (97.9%, a difference of 0.0%), Immigrants from Canada (97.9%, a difference of 0.010%), Russian (97.9%, a difference of 0.010%), American (97.9%, a difference of 0.020%), and Immigrants from Northern Europe (97.9%, a difference of 0.020%).
| Demographics | Rating | Rank | 5th Grade |
| Creek | 99.8 /100 | #55 | Exceptional 98.0% |
| Greeks | 99.8 /100 | #56 | Exceptional 97.9% |
| Austrians | 99.8 /100 | #57 | Exceptional 97.9% |
| Whites/Caucasians | 99.8 /100 | #58 | Exceptional 97.9% |
| Americans | 99.7 /100 | #59 | Exceptional 97.9% |
| Immigrants | Canada | 99.7 /100 | #60 | Exceptional 97.9% |
| Serbians | 99.7 /100 | #61 | Exceptional 97.9% |
| Immigrants | North America | 99.7 /100 | #62 | Exceptional 97.9% |
| Russians | 99.7 /100 | #63 | Exceptional 97.9% |
| Immigrants | Northern Europe | 99.6 /100 | #64 | Exceptional 97.9% |
| Canadians | 99.6 /100 | #65 | Exceptional 97.9% |
| Immigrants | Austria | 99.6 /100 | #66 | Exceptional 97.9% |
| New Zealanders | 99.6 /100 | #67 | Exceptional 97.9% |
| Cajuns | 99.6 /100 | #68 | Exceptional 97.9% |
| Kiowa | 99.5 /100 | #69 | Exceptional 97.9% |
Demographics Similar to Immigrants from North Macedonia by 5th Grade
In terms of 5th grade, the demographic groups most similar to Immigrants from North Macedonia are Seminole (97.5%, a difference of 0.0%), Israeli (97.5%, a difference of 0.0%), Filipino (97.5%, a difference of 0.010%), Blackfeet (97.5%, a difference of 0.010%), and Immigrants from Turkey (97.5%, a difference of 0.010%).
| Demographics | Rating | Rank | 5th Grade |
| Immigrants | Moldova | 87.5 /100 | #136 | Excellent 97.5% |
| Filipinos | 86.8 /100 | #137 | Excellent 97.5% |
| Blackfeet | 86.8 /100 | #138 | Excellent 97.5% |
| Immigrants | Turkey | 86.7 /100 | #139 | Excellent 97.5% |
| Burmese | 86.1 /100 | #140 | Excellent 97.5% |
| Seminole | 85.8 /100 | #141 | Excellent 97.5% |
| Israelis | 85.5 /100 | #142 | Excellent 97.5% |
| Immigrants | North Macedonia | 85.4 /100 | #143 | Excellent 97.5% |
| Immigrants | Greece | 83.2 /100 | #144 | Excellent 97.5% |
| Jordanians | 82.6 /100 | #145 | Excellent 97.5% |
| Spaniards | 81.9 /100 | #146 | Excellent 97.5% |
| Soviet Union | 81.2 /100 | #147 | Excellent 97.5% |
| Immigrants | Israel | 79.1 /100 | #148 | Good 97.5% |
| Hopi | 78.6 /100 | #149 | Good 97.5% |
| Immigrants | South Central Asia | 78.6 /100 | #150 | Good 97.5% |