Immigrants from North America vs Immigrants from Bangladesh 11th Grade
COMPARE
Immigrants from North America
Immigrants from Bangladesh
11th Grade
11th Grade Comparison
Immigrants from North America
Immigrants from Bangladesh
94.0%
11TH GRADE
99.9/ 100
METRIC RATING
54th/ 347
METRIC RANK
89.5%
11TH GRADE
0.0/ 100
METRIC RATING
309th/ 347
METRIC RANK
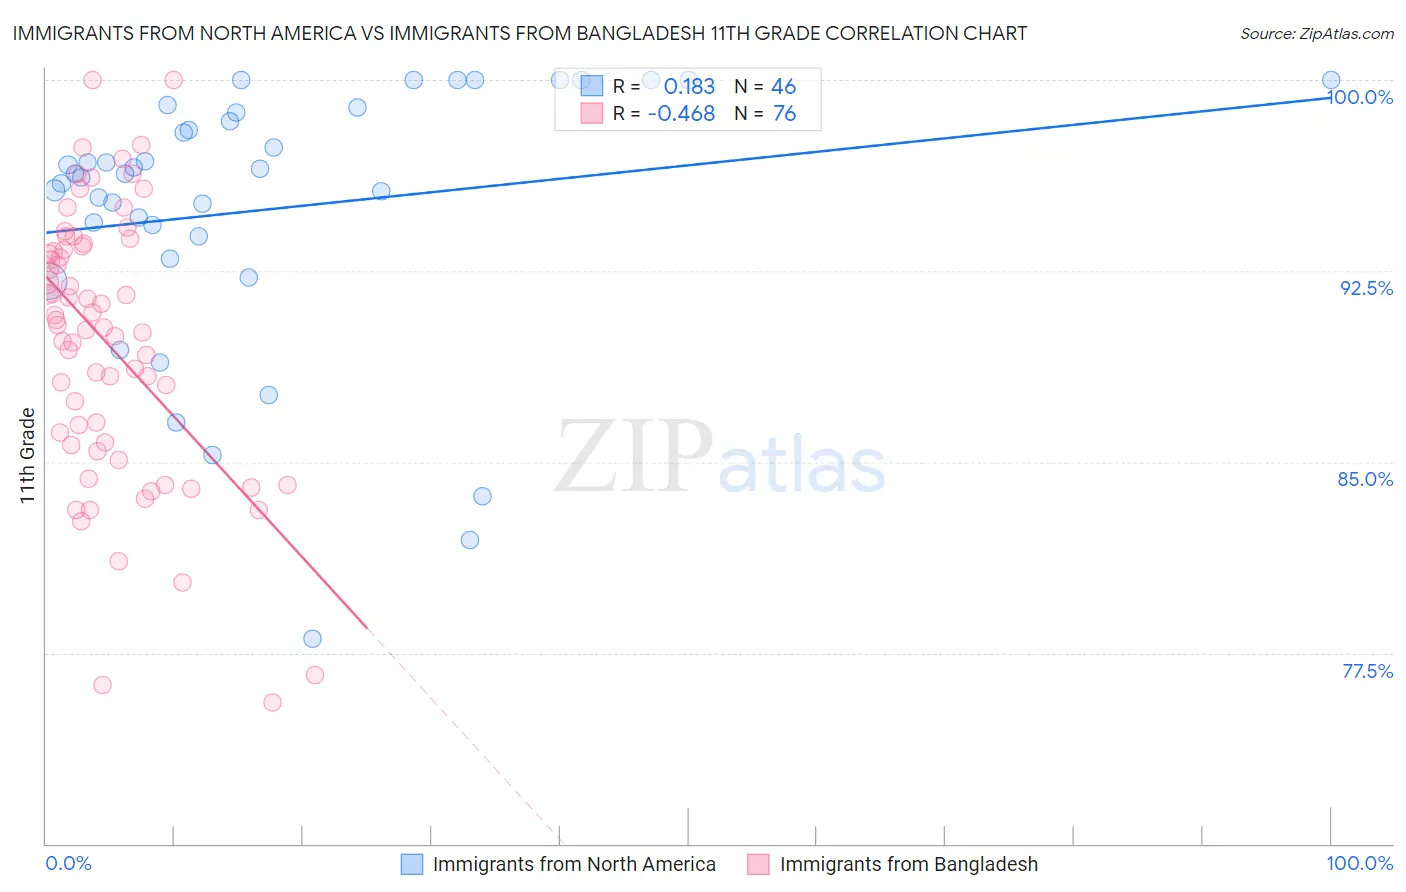
Immigrants from North America vs Immigrants from Bangladesh 11th Grade Correlation Chart
The statistical analysis conducted on geographies consisting of 462,461,913 people shows a poor positive correlation between the proportion of Immigrants from North America and percentage of population with at least 11th grade education in the United States with a correlation coefficient (R) of 0.183 and weighted average of 94.0%. Similarly, the statistical analysis conducted on geographies consisting of 203,672,706 people shows a moderate negative correlation between the proportion of Immigrants from Bangladesh and percentage of population with at least 11th grade education in the United States with a correlation coefficient (R) of -0.468 and weighted average of 89.5%, a difference of 5.0%.
11th Grade Correlation Summary
| Measurement | Immigrants from North America | Immigrants from Bangladesh |
| Minimum | 78.1% | 75.6% |
| Maximum | 100.0% | 100.0% |
| Range | 21.9% | 24.4% |
| Mean | 94.9% | 89.6% |
| Median | 96.3% | 90.3% |
| Interquartile 25% (IQ1) | 93.9% | 85.7% |
| Interquartile 75% (IQ3) | 98.7% | 93.4% |
| Interquartile Range (IQR) | 4.9% | 7.7% |
| Standard Deviation (Sample) | 5.2% | 5.3% |
| Standard Deviation (Population) | 5.2% | 5.3% |
Similar Demographics by 11th Grade
Demographics Similar to Immigrants from North America by 11th Grade
In terms of 11th grade, the demographic groups most similar to Immigrants from North America are Czechoslovakian (94.0%, a difference of 0.0%), Immigrants from Australia (94.0%, a difference of 0.010%), French Canadian (94.0%, a difference of 0.010%), New Zealander (94.0%, a difference of 0.010%), and Iranian (94.0%, a difference of 0.010%).
| Demographics | Rating | Rank | 11th Grade |
| Filipinos | 99.9 /100 | #47 | Exceptional 94.1% |
| Macedonians | 99.9 /100 | #48 | Exceptional 94.1% |
| Slavs | 99.9 /100 | #49 | Exceptional 94.1% |
| French | 99.9 /100 | #50 | Exceptional 94.1% |
| Turks | 99.9 /100 | #51 | Exceptional 94.0% |
| Immigrants | Canada | 99.9 /100 | #52 | Exceptional 94.0% |
| Immigrants | Australia | 99.9 /100 | #53 | Exceptional 94.0% |
| Immigrants | North America | 99.9 /100 | #54 | Exceptional 94.0% |
| Czechoslovakians | 99.9 /100 | #55 | Exceptional 94.0% |
| French Canadians | 99.9 /100 | #56 | Exceptional 94.0% |
| New Zealanders | 99.9 /100 | #57 | Exceptional 94.0% |
| Iranians | 99.9 /100 | #58 | Exceptional 94.0% |
| Bhutanese | 99.8 /100 | #59 | Exceptional 94.0% |
| Okinawans | 99.8 /100 | #60 | Exceptional 94.0% |
| Immigrants | Belgium | 99.8 /100 | #61 | Exceptional 94.0% |
Demographics Similar to Immigrants from Bangladesh by 11th Grade
In terms of 11th grade, the demographic groups most similar to Immigrants from Bangladesh are Yaqui (89.5%, a difference of 0.010%), Nepalese (89.5%, a difference of 0.020%), Immigrants from Dominica (89.5%, a difference of 0.040%), Vietnamese (89.4%, a difference of 0.080%), and Ecuadorian (89.6%, a difference of 0.10%).
| Demographics | Rating | Rank | 11th Grade |
| Immigrants | Guyana | 0.0 /100 | #302 | Tragic 89.7% |
| Immigrants | Immigrants | 0.0 /100 | #303 | Tragic 89.7% |
| Yuman | 0.0 /100 | #304 | Tragic 89.7% |
| Immigrants | Cambodia | 0.0 /100 | #305 | Tragic 89.6% |
| Ecuadorians | 0.0 /100 | #306 | Tragic 89.6% |
| Immigrants | Dominica | 0.0 /100 | #307 | Tragic 89.5% |
| Nepalese | 0.0 /100 | #308 | Tragic 89.5% |
| Immigrants | Bangladesh | 0.0 /100 | #309 | Tragic 89.5% |
| Yaqui | 0.0 /100 | #310 | Tragic 89.5% |
| Vietnamese | 0.0 /100 | #311 | Tragic 89.4% |
| Immigrants | Portugal | 0.0 /100 | #312 | Tragic 89.3% |
| Immigrants | Caribbean | 0.0 /100 | #313 | Tragic 89.1% |
| Cape Verdeans | 0.0 /100 | #314 | Tragic 89.1% |
| Immigrants | Ecuador | 0.0 /100 | #315 | Tragic 89.1% |
| Immigrants | Cuba | 0.0 /100 | #316 | Tragic 88.9% |