Immigrants from Nigeria vs Colombian 8th Grade
COMPARE
Immigrants from Nigeria
Colombian
8th Grade
8th Grade Comparison
Immigrants from Nigeria
Colombians
94.9%
8TH GRADE
0.4/ 100
METRIC RATING
262nd/ 347
METRIC RANK
95.0%
8TH GRADE
0.7/ 100
METRIC RATING
256th/ 347
METRIC RANK
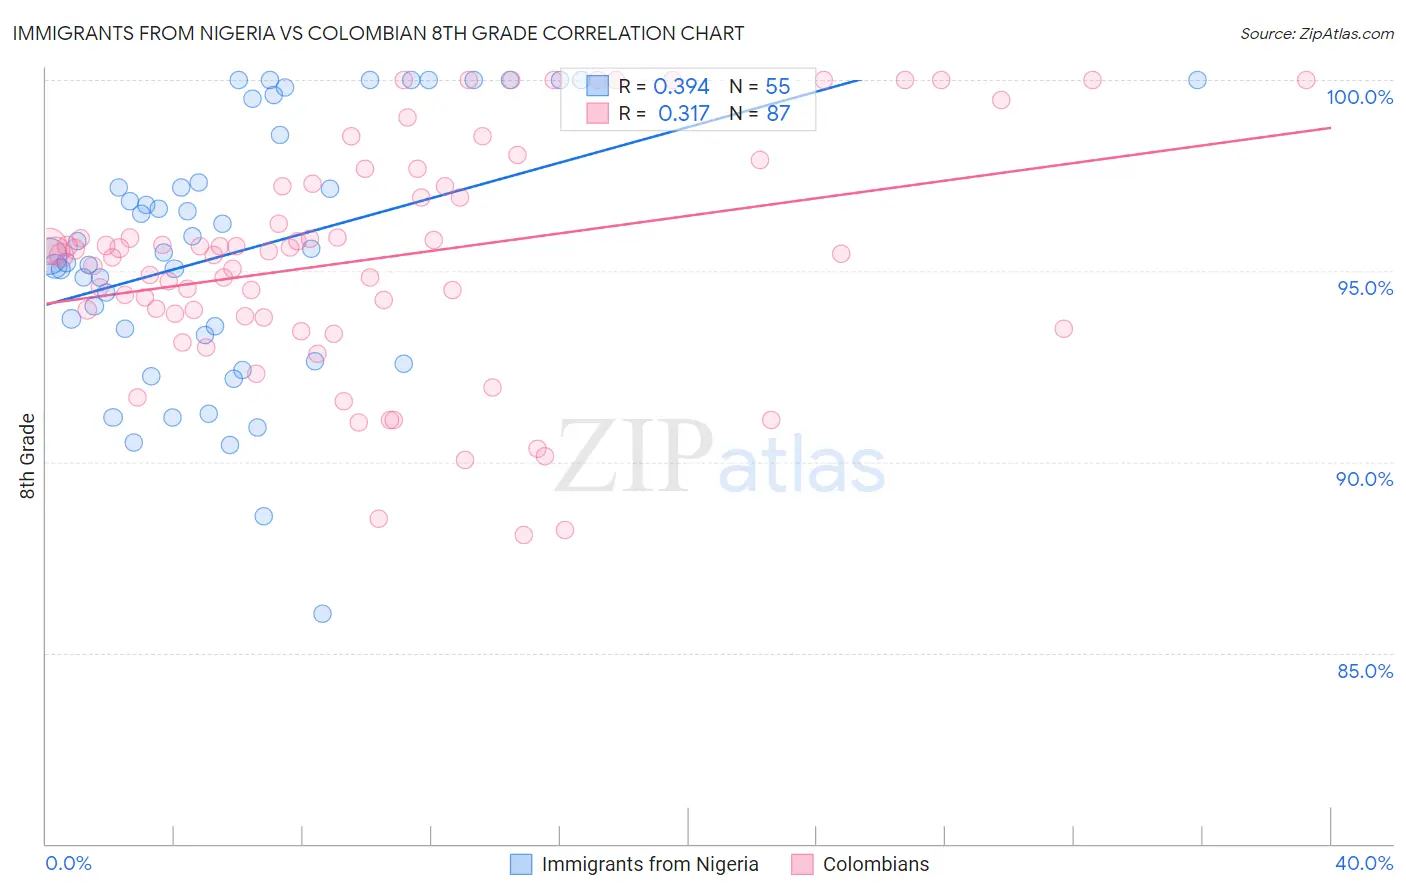
Immigrants from Nigeria vs Colombian 8th Grade Correlation Chart
The statistical analysis conducted on geographies consisting of 283,441,873 people shows a mild positive correlation between the proportion of Immigrants from Nigeria and percentage of population with at least 8th grade education in the United States with a correlation coefficient (R) of 0.394 and weighted average of 94.9%. Similarly, the statistical analysis conducted on geographies consisting of 419,655,116 people shows a mild positive correlation between the proportion of Colombians and percentage of population with at least 8th grade education in the United States with a correlation coefficient (R) of 0.317 and weighted average of 95.0%, a difference of 0.080%.
8th Grade Correlation Summary
| Measurement | Immigrants from Nigeria | Colombian |
| Minimum | 86.0% | 88.1% |
| Maximum | 100.0% | 100.0% |
| Range | 14.0% | 11.9% |
| Mean | 95.5% | 95.3% |
| Median | 95.5% | 95.5% |
| Interquartile 25% (IQ1) | 93.3% | 93.8% |
| Interquartile 75% (IQ3) | 98.6% | 97.2% |
| Interquartile Range (IQR) | 5.2% | 3.4% |
| Standard Deviation (Sample) | 3.4% | 3.0% |
| Standard Deviation (Population) | 3.3% | 2.9% |
Demographics Similar to Immigrants from Nigeria and Colombians by 8th Grade
In terms of 8th grade, the demographic groups most similar to Immigrants from Nigeria are Immigrants from Hong Kong (94.9%, a difference of 0.010%), South American (94.9%, a difference of 0.010%), Yuman (94.9%, a difference of 0.010%), Immigrants from Costa Rica (94.9%, a difference of 0.020%), and Immigrants from Jamaica (94.9%, a difference of 0.050%). Similarly, the demographic groups most similar to Colombians are Immigrants from Somalia (95.0%, a difference of 0.010%), Afghan (94.9%, a difference of 0.010%), Immigrants from Congo (94.9%, a difference of 0.020%), Ghanaian (94.9%, a difference of 0.020%), and Immigrants from Cameroon (95.0%, a difference of 0.030%).
| Demographics | Rating | Rank | 8th Grade |
| Immigrants | China | 1.1 /100 | #249 | Tragic 95.0% |
| Koreans | 1.1 /100 | #250 | Tragic 95.0% |
| Bolivians | 1.0 /100 | #251 | Tragic 95.0% |
| Immigrants | Ethiopia | 1.0 /100 | #252 | Tragic 95.0% |
| U.S. Virgin Islanders | 0.9 /100 | #253 | Tragic 95.0% |
| Immigrants | Cameroon | 0.8 /100 | #254 | Tragic 95.0% |
| Immigrants | Somalia | 0.7 /100 | #255 | Tragic 95.0% |
| Colombians | 0.7 /100 | #256 | Tragic 95.0% |
| Afghans | 0.6 /100 | #257 | Tragic 94.9% |
| Immigrants | Congo | 0.6 /100 | #258 | Tragic 94.9% |
| Ghanaians | 0.6 /100 | #259 | Tragic 94.9% |
| Immigrants | Jamaica | 0.6 /100 | #260 | Tragic 94.9% |
| Immigrants | Costa Rica | 0.5 /100 | #261 | Tragic 94.9% |
| Immigrants | Nigeria | 0.4 /100 | #262 | Tragic 94.9% |
| Immigrants | Hong Kong | 0.4 /100 | #263 | Tragic 94.9% |
| South Americans | 0.4 /100 | #264 | Tragic 94.9% |
| Yuman | 0.4 /100 | #265 | Tragic 94.9% |
| West Indians | 0.3 /100 | #266 | Tragic 94.8% |
| Immigrants | Ghana | 0.3 /100 | #267 | Tragic 94.8% |
| Immigrants | Uruguay | 0.3 /100 | #268 | Tragic 94.8% |
| Immigrants | Thailand | 0.2 /100 | #269 | Tragic 94.8% |