Immigrants from Nicaragua vs Kenyan 11th Grade
COMPARE
Immigrants from Nicaragua
Kenyan
11th Grade
11th Grade Comparison
Immigrants from Nicaragua
Kenyans
88.1%
11TH GRADE
0.0/ 100
METRIC RATING
325th/ 347
METRIC RANK
92.9%
11TH GRADE
82.0/ 100
METRIC RATING
142nd/ 347
METRIC RANK
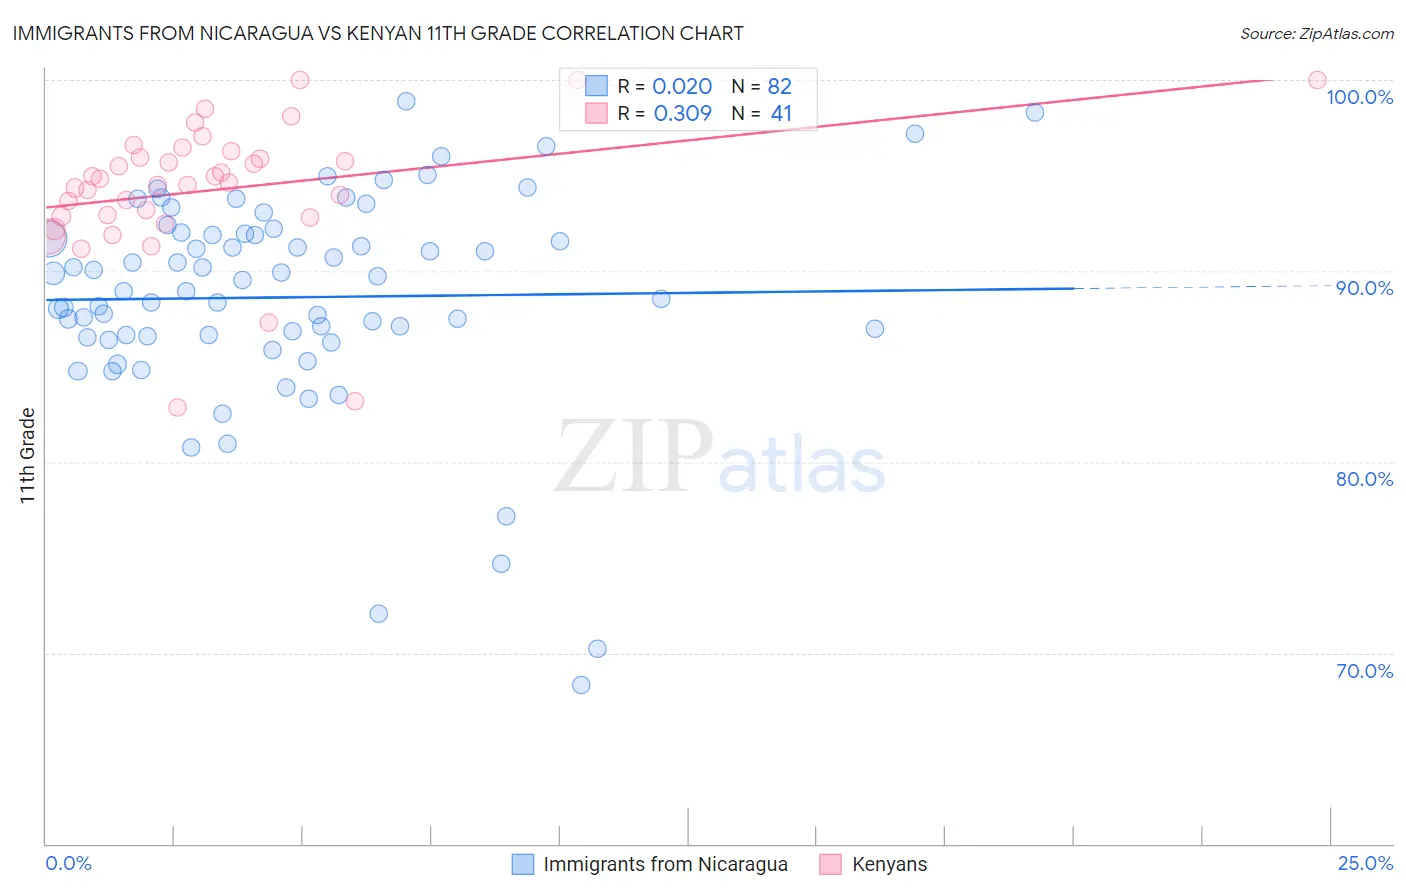
Immigrants from Nicaragua vs Kenyan 11th Grade Correlation Chart
The statistical analysis conducted on geographies consisting of 236,340,506 people shows no correlation between the proportion of Immigrants from Nicaragua and percentage of population with at least 11th grade education in the United States with a correlation coefficient (R) of 0.020 and weighted average of 88.1%. Similarly, the statistical analysis conducted on geographies consisting of 168,244,042 people shows a mild positive correlation between the proportion of Kenyans and percentage of population with at least 11th grade education in the United States with a correlation coefficient (R) of 0.309 and weighted average of 92.9%, a difference of 5.4%.
11th Grade Correlation Summary
| Measurement | Immigrants from Nicaragua | Kenyan |
| Minimum | 68.3% | 82.9% |
| Maximum | 98.9% | 100.0% |
| Range | 30.6% | 17.1% |
| Mean | 88.6% | 94.3% |
| Median | 89.2% | 94.6% |
| Interquartile 25% (IQ1) | 86.6% | 92.8% |
| Interquartile 75% (IQ3) | 92.0% | 96.1% |
| Interquartile Range (IQR) | 5.4% | 3.3% |
| Standard Deviation (Sample) | 5.7% | 3.6% |
| Standard Deviation (Population) | 5.6% | 3.6% |
Similar Demographics by 11th Grade
Demographics Similar to Immigrants from Nicaragua by 11th Grade
In terms of 11th grade, the demographic groups most similar to Immigrants from Nicaragua are Central American Indian (88.2%, a difference of 0.13%), Pima (88.3%, a difference of 0.17%), Puerto Rican (88.4%, a difference of 0.25%), Dominican (87.7%, a difference of 0.54%), and Immigrants from Cabo Verde (87.6%, a difference of 0.57%).
| Demographics | Rating | Rank | 11th Grade |
| Nicaraguans | 0.0 /100 | #318 | Tragic 88.9% |
| Belizeans | 0.0 /100 | #319 | Tragic 88.8% |
| Immigrants | Armenia | 0.0 /100 | #320 | Tragic 88.8% |
| Immigrants | Belize | 0.0 /100 | #321 | Tragic 88.7% |
| Puerto Ricans | 0.0 /100 | #322 | Tragic 88.4% |
| Pima | 0.0 /100 | #323 | Tragic 88.3% |
| Central American Indians | 0.0 /100 | #324 | Tragic 88.2% |
| Immigrants | Nicaragua | 0.0 /100 | #325 | Tragic 88.1% |
| Dominicans | 0.0 /100 | #326 | Tragic 87.7% |
| Immigrants | Cabo Verde | 0.0 /100 | #327 | Tragic 87.6% |
| Tohono O'odham | 0.0 /100 | #328 | Tragic 87.6% |
| Mexican American Indians | 0.0 /100 | #329 | Tragic 87.5% |
| Hondurans | 0.0 /100 | #330 | Tragic 87.4% |
| Hispanics or Latinos | 0.0 /100 | #331 | Tragic 87.3% |
| Immigrants | Azores | 0.0 /100 | #332 | Tragic 87.2% |
Demographics Similar to Kenyans by 11th Grade
In terms of 11th grade, the demographic groups most similar to Kenyans are Ugandan (92.9%, a difference of 0.010%), Venezuelan (92.9%, a difference of 0.020%), Chilean (92.9%, a difference of 0.020%), Assyrian/Chaldean/Syriac (92.8%, a difference of 0.030%), and Crow (92.9%, a difference of 0.040%).
| Demographics | Rating | Rank | 11th Grade |
| Immigrants | Italy | 86.6 /100 | #135 | Excellent 92.9% |
| Cree | 85.9 /100 | #136 | Excellent 92.9% |
| Arabs | 85.4 /100 | #137 | Excellent 92.9% |
| Immigrants | Brazil | 85.1 /100 | #138 | Excellent 92.9% |
| Crow | 84.1 /100 | #139 | Excellent 92.9% |
| Venezuelans | 83.4 /100 | #140 | Excellent 92.9% |
| Chileans | 83.0 /100 | #141 | Excellent 92.9% |
| Kenyans | 82.0 /100 | #142 | Excellent 92.9% |
| Ugandans | 81.4 /100 | #143 | Excellent 92.9% |
| Assyrians/Chaldeans/Syriacs | 80.5 /100 | #144 | Excellent 92.8% |
| Pakistanis | 79.6 /100 | #145 | Good 92.8% |
| Iroquois | 79.1 /100 | #146 | Good 92.8% |
| Immigrants | Kenya | 78.7 /100 | #147 | Good 92.8% |
| Hmong | 78.6 /100 | #148 | Good 92.8% |
| Immigrants | Poland | 78.5 /100 | #149 | Good 92.8% |