Immigrants from Netherlands vs Immigrants from Italy Professional Degree
COMPARE
Immigrants from Netherlands
Immigrants from Italy
Professional Degree
Professional Degree Comparison
Immigrants from Netherlands
Immigrants from Italy
5.8%
PROFESSIONAL DEGREE
100.0/ 100
METRIC RATING
53rd/ 347
METRIC RANK
5.2%
PROFESSIONAL DEGREE
99.1/ 100
METRIC RATING
99th/ 347
METRIC RANK
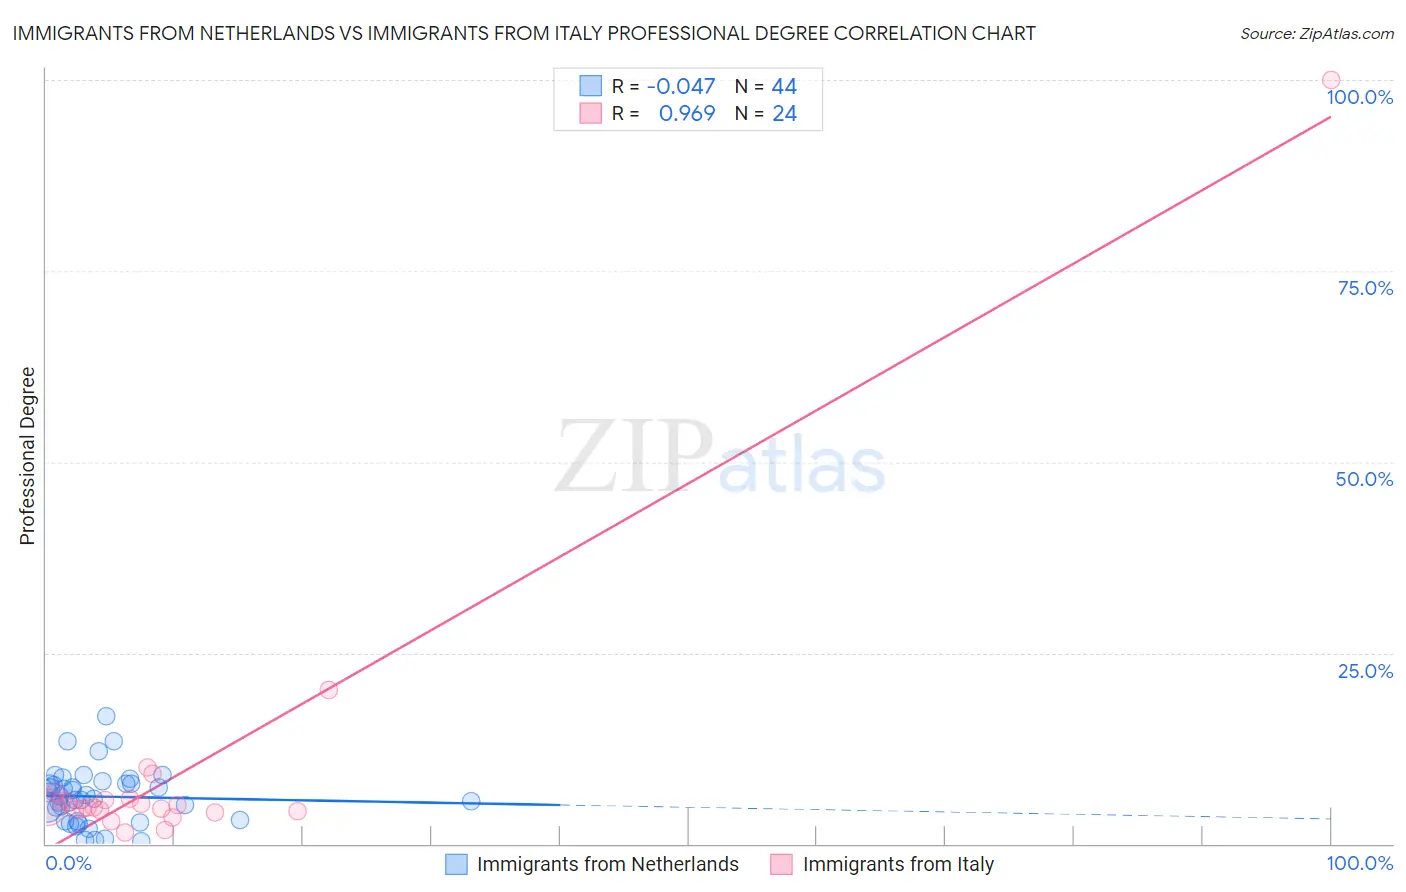
Immigrants from Netherlands vs Immigrants from Italy Professional Degree Correlation Chart
The statistical analysis conducted on geographies consisting of 237,680,329 people shows no correlation between the proportion of Immigrants from Netherlands and percentage of population with at least professional degree education in the United States with a correlation coefficient (R) of -0.047 and weighted average of 5.8%. Similarly, the statistical analysis conducted on geographies consisting of 323,812,210 people shows a perfect positive correlation between the proportion of Immigrants from Italy and percentage of population with at least professional degree education in the United States with a correlation coefficient (R) of 0.969 and weighted average of 5.2%, a difference of 12.5%.
Professional Degree Correlation Summary
| Measurement | Immigrants from Netherlands | Immigrants from Italy |
| Minimum | 0.31% | 1.5% |
| Maximum | 16.8% | 100.0% |
| Range | 16.4% | 98.5% |
| Mean | 6.2% | 9.6% |
| Median | 6.1% | 4.8% |
| Interquartile 25% (IQ1) | 3.1% | 4.4% |
| Interquartile 75% (IQ3) | 7.9% | 5.8% |
| Interquartile Range (IQR) | 4.8% | 1.4% |
| Standard Deviation (Sample) | 3.6% | 19.6% |
| Standard Deviation (Population) | 3.5% | 19.2% |
Similar Demographics by Professional Degree
Demographics Similar to Immigrants from Netherlands by Professional Degree
In terms of professional degree, the demographic groups most similar to Immigrants from Netherlands are Immigrants from Serbia (5.8%, a difference of 0.23%), Immigrants from Greece (5.8%, a difference of 0.30%), Immigrants from Czechoslovakia (5.8%, a difference of 0.36%), Immigrants from Latvia (5.8%, a difference of 0.68%), and Immigrants from Kuwait (5.7%, a difference of 1.0%).
| Demographics | Rating | Rank | Professional Degree |
| Immigrants | Argentina | 100.0 /100 | #46 | Exceptional 5.9% |
| Australians | 100.0 /100 | #47 | Exceptional 5.9% |
| Paraguayans | 100.0 /100 | #48 | Exceptional 5.9% |
| Immigrants | Latvia | 100.0 /100 | #49 | Exceptional 5.8% |
| Immigrants | Czechoslovakia | 100.0 /100 | #50 | Exceptional 5.8% |
| Immigrants | Greece | 100.0 /100 | #51 | Exceptional 5.8% |
| Immigrants | Serbia | 100.0 /100 | #52 | Exceptional 5.8% |
| Immigrants | Netherlands | 100.0 /100 | #53 | Exceptional 5.8% |
| Immigrants | Kuwait | 100.0 /100 | #54 | Exceptional 5.7% |
| Immigrants | Western Europe | 100.0 /100 | #55 | Exceptional 5.7% |
| Immigrants | Malaysia | 100.0 /100 | #56 | Exceptional 5.7% |
| South Africans | 100.0 /100 | #57 | Exceptional 5.7% |
| Bulgarians | 100.0 /100 | #58 | Exceptional 5.7% |
| Immigrants | Europe | 100.0 /100 | #59 | Exceptional 5.6% |
| Bolivians | 99.9 /100 | #60 | Exceptional 5.6% |
Demographics Similar to Immigrants from Italy by Professional Degree
In terms of professional degree, the demographic groups most similar to Immigrants from Italy are Austrian (5.2%, a difference of 0.060%), Syrian (5.2%, a difference of 0.080%), Immigrants from Uzbekistan (5.2%, a difference of 0.43%), Ugandan (5.1%, a difference of 0.76%), and Zimbabwean (5.2%, a difference of 0.84%).
| Demographics | Rating | Rank | Professional Degree |
| Immigrants | Eastern Europe | 99.5 /100 | #92 | Exceptional 5.2% |
| Northern Europeans | 99.3 /100 | #93 | Exceptional 5.2% |
| Alsatians | 99.3 /100 | #94 | Exceptional 5.2% |
| Zimbabweans | 99.3 /100 | #95 | Exceptional 5.2% |
| Immigrants | Uzbekistan | 99.2 /100 | #96 | Exceptional 5.2% |
| Syrians | 99.1 /100 | #97 | Exceptional 5.2% |
| Austrians | 99.1 /100 | #98 | Exceptional 5.2% |
| Immigrants | Italy | 99.1 /100 | #99 | Exceptional 5.2% |
| Ugandans | 98.8 /100 | #100 | Exceptional 5.1% |
| Immigrants | Egypt | 98.5 /100 | #101 | Exceptional 5.1% |
| Ukrainians | 98.5 /100 | #102 | Exceptional 5.1% |
| Immigrants | Northern Africa | 98.4 /100 | #103 | Exceptional 5.1% |
| Arabs | 98.2 /100 | #104 | Exceptional 5.0% |
| Immigrants | Uganda | 98.2 /100 | #105 | Exceptional 5.0% |
| Immigrants | Ukraine | 98.2 /100 | #106 | Exceptional 5.0% |