Immigrants from Netherlands vs Honduran 7th Grade
COMPARE
Immigrants from Netherlands
Honduran
7th Grade
7th Grade Comparison
Immigrants from Netherlands
Hondurans
96.8%
7TH GRADE
99.3/ 100
METRIC RATING
78th/ 347
METRIC RANK
92.9%
7TH GRADE
0.0/ 100
METRIC RATING
331st/ 347
METRIC RANK
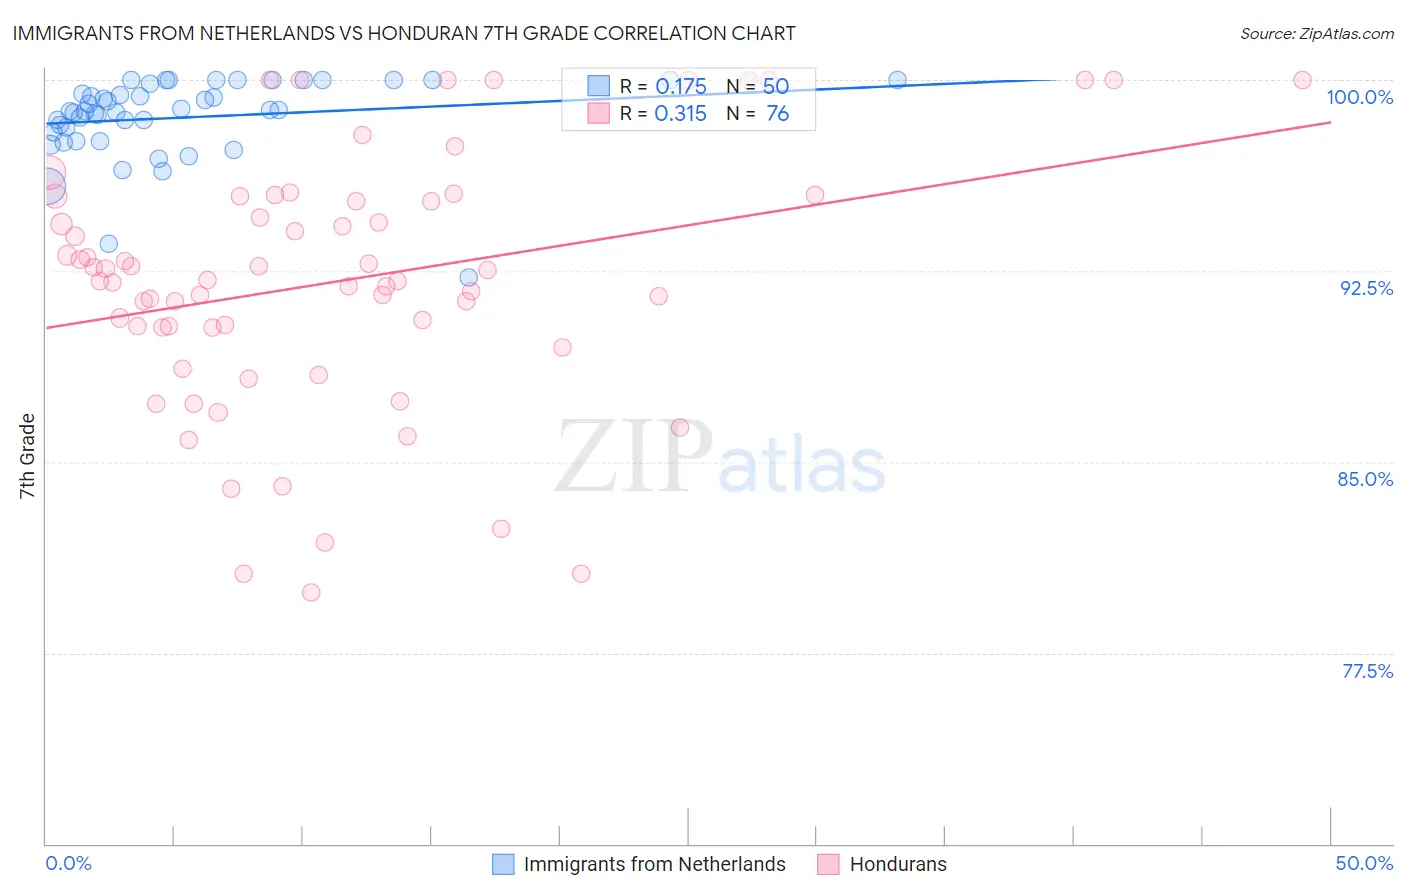
Immigrants from Netherlands vs Honduran 7th Grade Correlation Chart
The statistical analysis conducted on geographies consisting of 237,869,934 people shows a poor positive correlation between the proportion of Immigrants from Netherlands and percentage of population with at least 7th grade education in the United States with a correlation coefficient (R) of 0.175 and weighted average of 96.8%. Similarly, the statistical analysis conducted on geographies consisting of 357,784,803 people shows a mild positive correlation between the proportion of Hondurans and percentage of population with at least 7th grade education in the United States with a correlation coefficient (R) of 0.315 and weighted average of 92.9%, a difference of 4.2%.
7th Grade Correlation Summary
| Measurement | Immigrants from Netherlands | Honduran |
| Minimum | 92.3% | 79.9% |
| Maximum | 100.0% | 100.0% |
| Range | 7.7% | 20.1% |
| Mean | 98.5% | 92.1% |
| Median | 98.8% | 92.1% |
| Interquartile 25% (IQ1) | 97.9% | 90.3% |
| Interquartile 75% (IQ3) | 99.8% | 95.3% |
| Interquartile Range (IQR) | 1.9% | 5.1% |
| Standard Deviation (Sample) | 1.6% | 5.0% |
| Standard Deviation (Population) | 1.6% | 4.9% |
Similar Demographics by 7th Grade
Demographics Similar to Immigrants from Netherlands by 7th Grade
In terms of 7th grade, the demographic groups most similar to Immigrants from Netherlands are Cypriot (96.8%, a difference of 0.0%), Yugoslavian (96.8%, a difference of 0.0%), Immigrants from Ireland (96.8%, a difference of 0.010%), Cherokee (96.8%, a difference of 0.010%), and Delaware (96.8%, a difference of 0.020%).
| Demographics | Rating | Rank | 7th Grade |
| Immigrants | Lithuania | 99.6 /100 | #71 | Exceptional 96.8% |
| Cajuns | 99.5 /100 | #72 | Exceptional 96.8% |
| Arapaho | 99.5 /100 | #73 | Exceptional 96.8% |
| Immigrants | England | 99.5 /100 | #74 | Exceptional 96.8% |
| Zimbabweans | 99.5 /100 | #75 | Exceptional 96.8% |
| Immigrants | Ireland | 99.4 /100 | #76 | Exceptional 96.8% |
| Cherokee | 99.4 /100 | #77 | Exceptional 96.8% |
| Immigrants | Netherlands | 99.3 /100 | #78 | Exceptional 96.8% |
| Cypriots | 99.3 /100 | #79 | Exceptional 96.8% |
| Yugoslavians | 99.3 /100 | #80 | Exceptional 96.8% |
| Delaware | 99.2 /100 | #81 | Exceptional 96.8% |
| Chickasaw | 99.2 /100 | #82 | Exceptional 96.7% |
| Icelanders | 99.1 /100 | #83 | Exceptional 96.7% |
| Romanians | 99.1 /100 | #84 | Exceptional 96.7% |
| Kiowa | 99.1 /100 | #85 | Exceptional 96.7% |
Demographics Similar to Hondurans by 7th Grade
In terms of 7th grade, the demographic groups most similar to Hondurans are Immigrants from Dominican Republic (92.9%, a difference of 0.040%), Immigrants from the Azores (93.0%, a difference of 0.090%), Immigrants from Nicaragua (93.0%, a difference of 0.13%), Hispanic or Latino (92.7%, a difference of 0.14%), and Immigrants from Armenia (92.7%, a difference of 0.16%).
| Demographics | Rating | Rank | 7th Grade |
| Dominicans | 0.0 /100 | #324 | Tragic 93.3% |
| Central American Indians | 0.0 /100 | #325 | Tragic 93.3% |
| Nepalese | 0.0 /100 | #326 | Tragic 93.2% |
| Immigrants | Cabo Verde | 0.0 /100 | #327 | Tragic 93.1% |
| Immigrants | Nicaragua | 0.0 /100 | #328 | Tragic 93.0% |
| Immigrants | Azores | 0.0 /100 | #329 | Tragic 93.0% |
| Immigrants | Dominican Republic | 0.0 /100 | #330 | Tragic 92.9% |
| Hondurans | 0.0 /100 | #331 | Tragic 92.9% |
| Hispanics or Latinos | 0.0 /100 | #332 | Tragic 92.7% |
| Immigrants | Armenia | 0.0 /100 | #333 | Tragic 92.7% |
| Immigrants | Yemen | 0.0 /100 | #334 | Tragic 92.6% |
| Mexican American Indians | 0.0 /100 | #335 | Tragic 92.6% |
| Immigrants | Honduras | 0.0 /100 | #336 | Tragic 92.5% |
| Immigrants | Latin America | 0.0 /100 | #337 | Tragic 92.2% |
| Central Americans | 0.0 /100 | #338 | Tragic 92.1% |